Usually, I have these done by mid-October. This year I am trying to get an early start on things. I am the walking embodiment of those Nationwide Insurance “Life comes at you fast” ads.
Because of that, this report may also be a bit leaner than previous years. Historically I walk you guys through all of the data, my decision-making process, and have even laid out scenarios. This year it may be a bit more cut-and-dry.
Though, you guys know me. If I am anything, it is verbose. But after this write-up, like always, the “bottom line” section will be at the end with a summary of everything and a snapshot view of the Outlook.
TELECONNECTIONS
Teleconnections are a lot of the “big picture” things meteorologists look at when trying to put together a seasonal or sub-seasonal forecast. A lot of us weather nerds call it the “alphabet soup” of weather. Because the teleconnections are all acronyms.
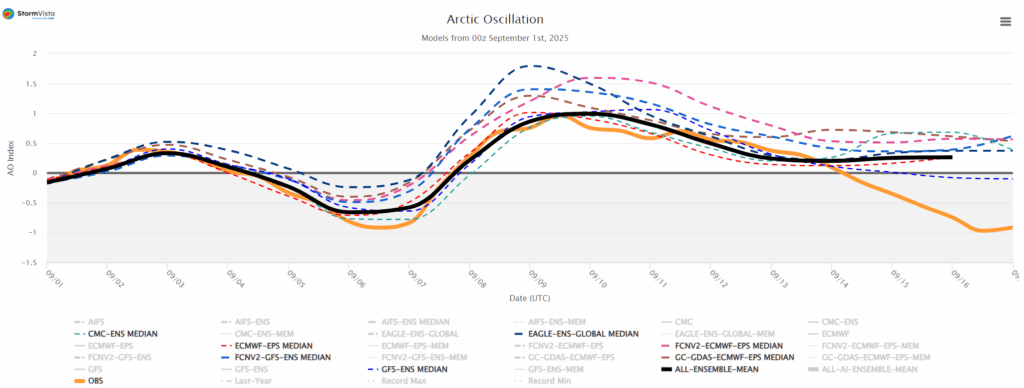
The AO, NAO, PNA, EPO, WPO, ABNA, EAWR, EA, and the SCAND are my favorites to look at for the 6-8 week window. The “AO” shown above goes up and down over a 1-2 week period. Some of the other teleconnections listed above oscillate on shorter timescales, others on longer.
But we also have the MJO and ENSO to look out 1-3 months. Those last two are probably ones you’ve heard of over the years. The MJO, or “Madden-Julian Oscillation,” plays a big role in the Atlantic Hurricane season activity and ENSO, or “El Nino Southern Oscillation,” is the El Nino / LA Nina pattern.
The ENSO pattern goes up and down across months.
All of these put together give an indication about what the weather may be like across a region for the next 3-6 weeks to 3-6 months. It is less so about picking out what the weather will do on a specific day and moreso about how the atmosphere may behave across a longer stretch of time. And from there we can say, “when the atmosphere looked like this, this type of weather occurred.”
HOW DO THE TELECONNECTIONS LOOK?
Teleconnection forecasts that are weather model-driven have a limit on how far out they are useful. Usually about 8 weeks. So, as of this writing, that means we can “see” through the month of November. No further.
But we can look at the shape of the teleconnections through the last few months and get an idea about how things “look” across the atmosphere during that time. We can then find other years with a similar look and shape. We can then assert that if past years looked similarly then this year should respond similarly.
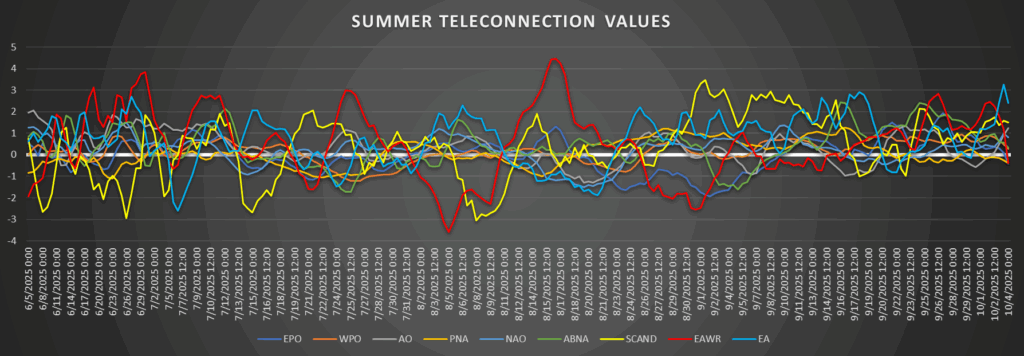
This tends to look like a plate of spaghetti. So get get math to help us out.
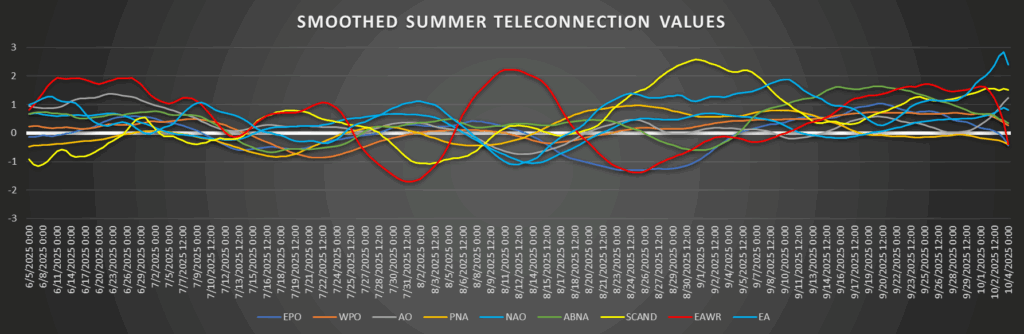
Much better!
So, from here, we can look back into history to compare similar past year with a similar shape for each teleconnection. And then say, okay, in these past years these shape of all teleconnections was similar so we can assume those winters will give us an idea about this upcoming winter.
But, I will say, doing so comes with a big asterisk. Sometimes similar Teleconnection values can lead to different weather outcomes. A combination of values in November can mean “warm with storms.” and in January can mean “cold and dry.” So we have to respect those differences.
All of that said! Past similar years for the Southern MS/AL/LA region include: 2008-2009, 2013-2014, 2016-2017, 2021-2022, 2022-2023
WHAT ARE WE SEEING THIS FALL FROM ENSO?
As we move into this autumn, the Climate Precision Center is showing a good shot for La Nina (ENSO) to peak sometime between now and the end of December.
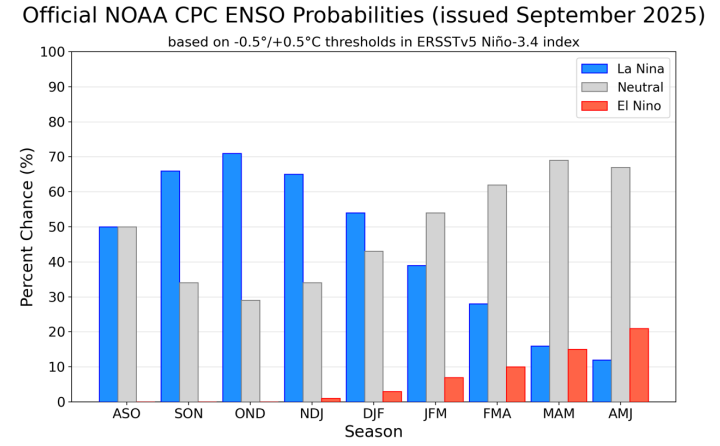
This early Winter peak for La Nina was last done in 2022. But that was a higher peak than we are expecting. Instead, this year we are expecting a bit of a muted La Nina. So we have to go back to 2016 to get a year that may look like this year for ENSO.
Usually, when looking at ENSO, I like to grab at least 5 years that are similar. And to do that I look at no only the values forecast but also the trajectory of change and the shape of the curve of past similar winters.
Those winters are: 2000-2001, 2005-2006, 2008-2009, 2013-2014, 2016-2017, 2017-2018, 2022-2023
PUTTING IT ALL TOGETHER
This Winter is looking like it has a few good analog years. These are years where both the shape of the teleconnections coming out of Summer and ENSO come up with similar years. We have 2008-2009, 2013-2014, 2016-2017 and 2022-2023.
For the moment I am going to leave out 2013-2014. I’ll explain that in a second. So, when we head over to the NOAA data, we have to rack them as 2009, 2017, and 2023 since they are catalogs as the year of the last month.
And we get these maps:
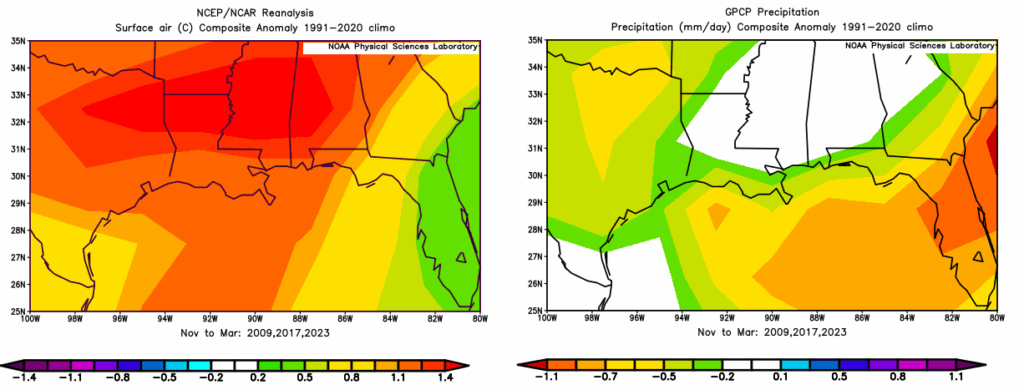
Not exactly cold. Nor rainy. It looks like rather mild and near normal precipitation.
In fact, these years are tied to higher drought index values, too. Perhaps less because of the lack of rain during the length of the season itself, but the antecedent conditions leading into the Winter months.
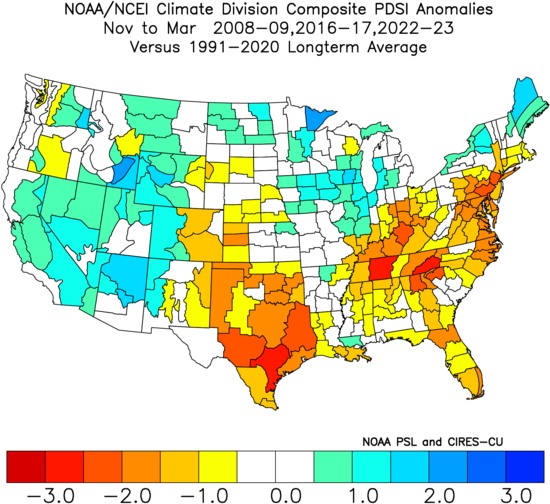
Drier soils, generally, means two things: it can get warmer easier and it can get cooler easier. Because water in the ground helps to keep the soil temps steadier. And when the ground temperature is steady, it helps to keep the air temperature steadier.
Okay, but now back to the year we held out. Why did I leave out 2013-2014? It was a very different year.
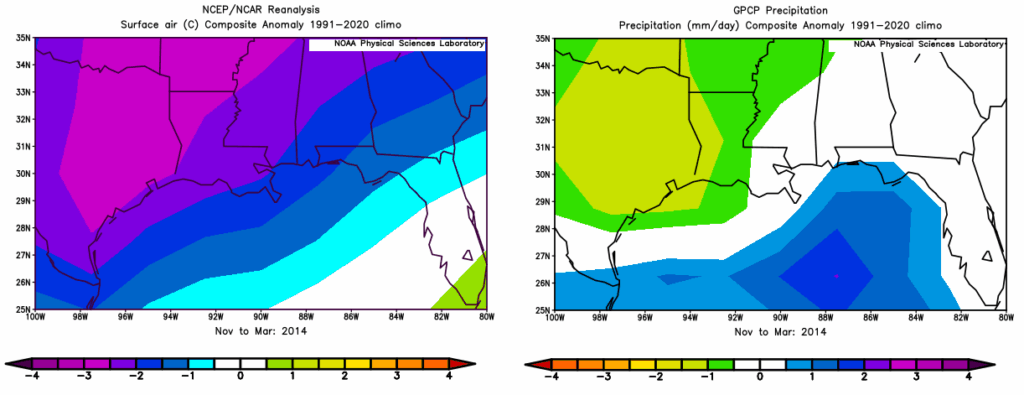
It was much colder than normal. And it was driven by multiple shots of cold nearly all Winter. We had a colder November, a chilly December, a very cold January, a cold February and a rather chilly March. Plus we had plenty of wintry precip that year with a few ice storms and snow in the region.
So, we have three analog years pointing toward warmer with near normal precipitation. And one very cold year with normal precipitation.
I know you might be thinking, “well what led to that year being so cold versus the other years that were so warm?”
It is a great question. Some folks may point to those Sudden Stratospheric Warming events that have become a big Weather Headline in recent years. This is the actual science behind what the national news and local TV meteorologists call the “Polar Vortex” when explaining big shots of cold in the Winter.
But looking back through time, 2013-2014 didn’t feature anything much different than any of our other years.
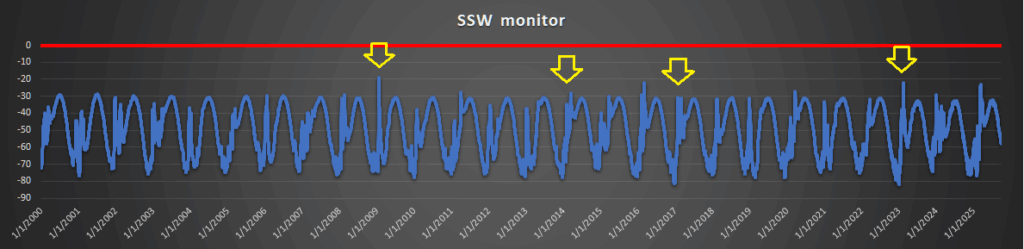
So what gives?
I would bet that it is a combination of the shorter-term weather pattern (that seasonal outlooks can’t discern) and teleconnections that were forecast to be transient but instead got “stuck” on a given value of “colder” at random. That led to weather patterns that were friendlier to creating cold sticking around for longer. And thus a colder Winter..
THE BOTTOM LINE
Here is a look at the Winter Outlook:
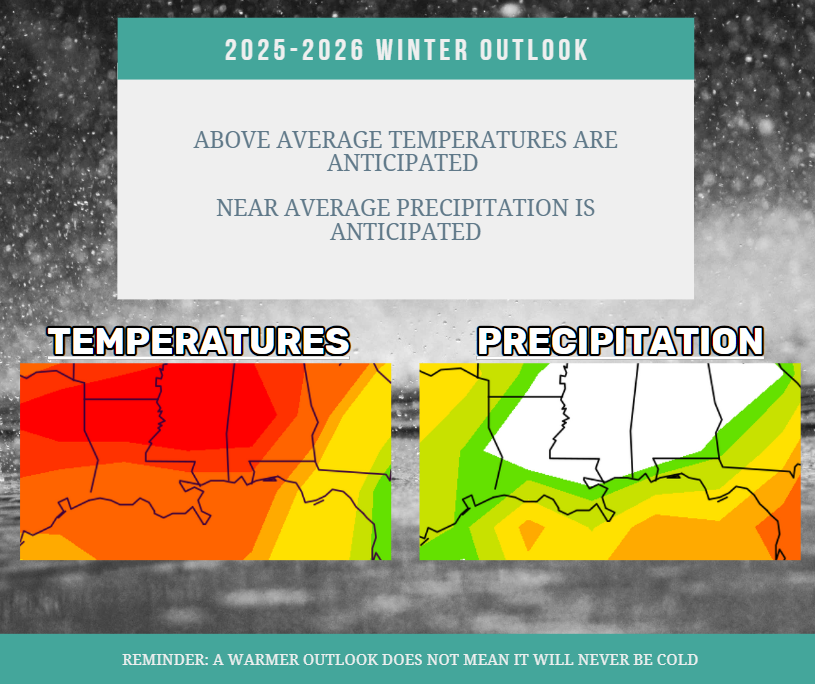
It looks like a warmer than normal Winter with near normal precipitation. Sure, we did have one of the four analog years that was quite cold but I’m not ready to throw out three years of warm just because we have a single year of cold.
What that does tell me, though, is that this Winter will feature an opportunity for shots of cold down to the Gulf Coast. And that those shots of cold have a higher-than-normal chance to happen this year than any other year.
While this outlook is mainly for the entire Gulf Coast, I want to take a moment to highlight some specific forecast points for the Southern MS/AL/LA region. That is the area in yellow on the map below.
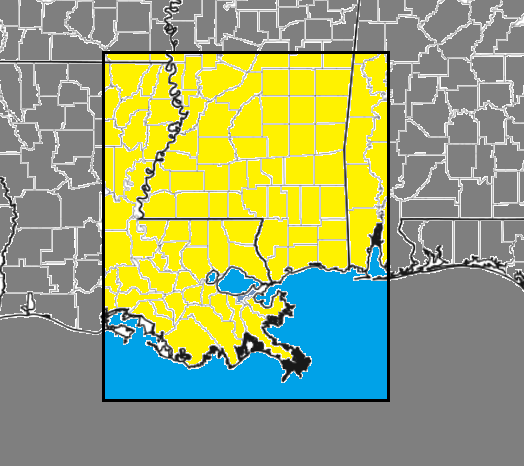
SPECIFIC SOUTHERN MS/AL/LA PREDICTIONS FOR NOV – MAR:
— 1 – 3 Regional snowfall / freezing rain events
— 14 – 18 days with Regional temperatures below freezing overnight
— 3 – 6 days with Regional temperatures below 40 for more than 24 hours
— 7 – 12 Severe Weather events with a Regional Slight Risk or higher
— 2 – 3 Severe weather events with a Regional Moderate Risk or higher
In previous years I have tried to give you a two-week by two-week forecast from November through March. Sadly, I don’t have time this year to dedicate to creating such a detailed forecast. But I will do my best to keep everyone ahead of the risk for any kind of crazy weather as best I can. Even if I can’t see it coming from 3 months away.


Thanks Nick!!!