Starting the holiday week with warm temperatures and scattered showers. These scattered showers will persist throughout the day and into Monday night. A warm frontal boundary is responsible for the warm temperatures, scattered showers, and cloudy skies ahead. The high temperature on Monday will be slightly lower than today, but will still reach the upper 60s to lower 70s.
A high-pressure dome will settle over us on Tuesday, causing some locations to reach temperatures in the mid-70s. The high-pressure dome will moderate the weather. Meaning fewer chances for rain, lower temperature variability, and a warm Christmas. Both Tuesday and Wednesday are expected to have high temperatures in the low to mid-70s.
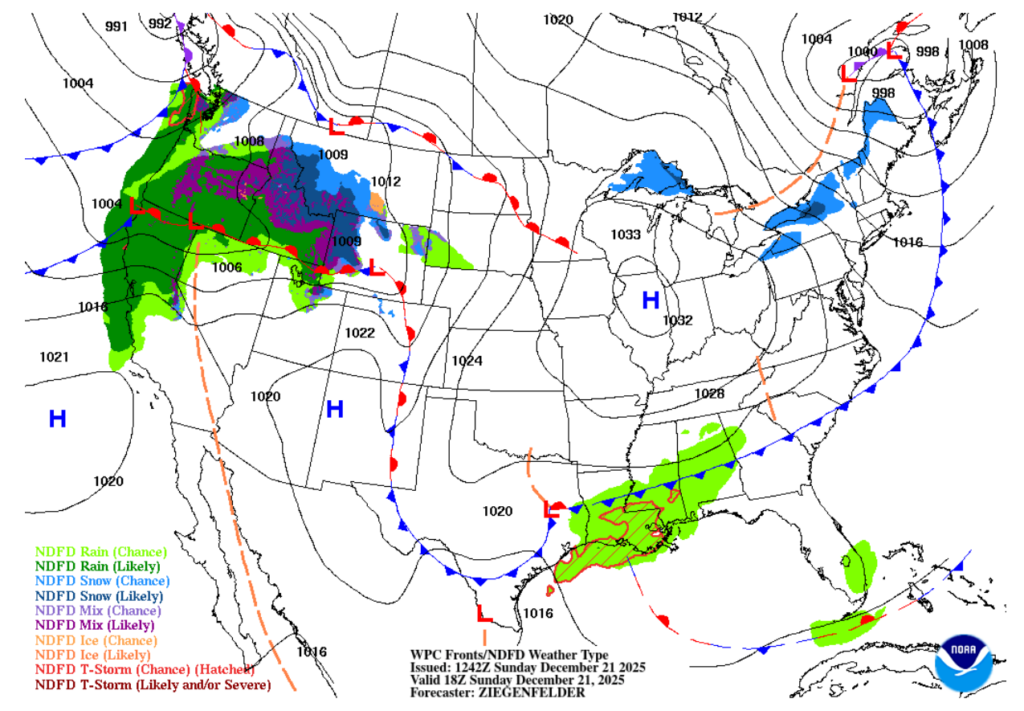
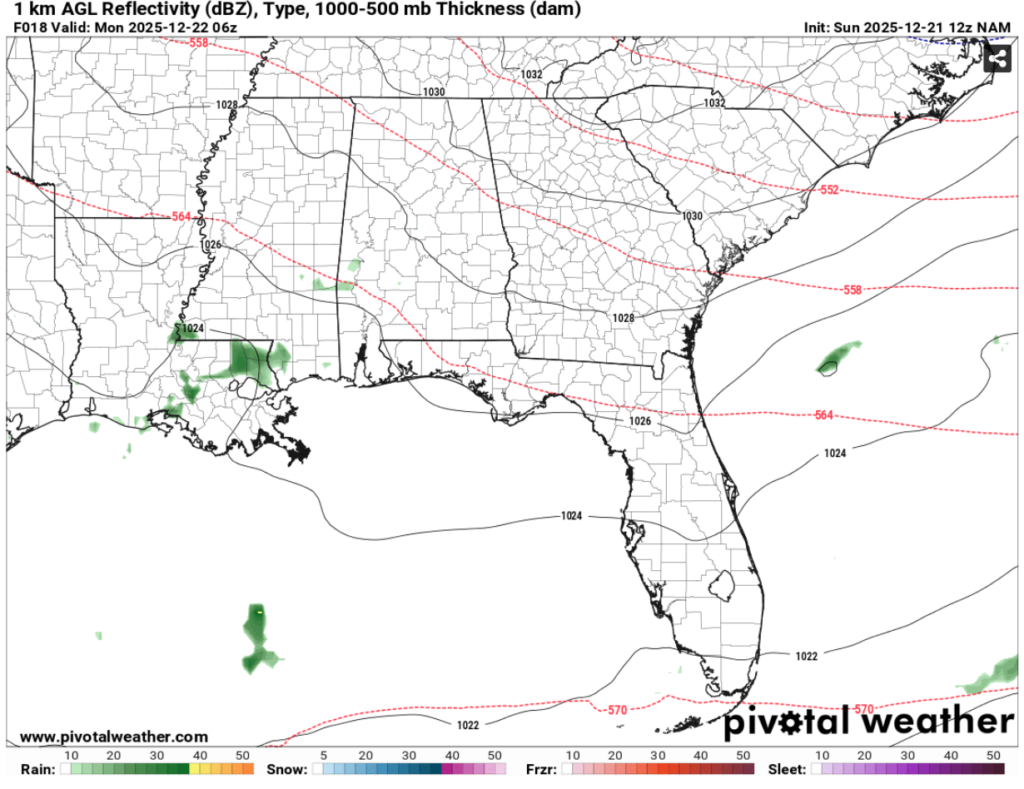
Looking at the image above, we can see that we are positioned along the frontal boundary, which explains why we will experience these rainy and cloudy conditions until the boundary moves out.
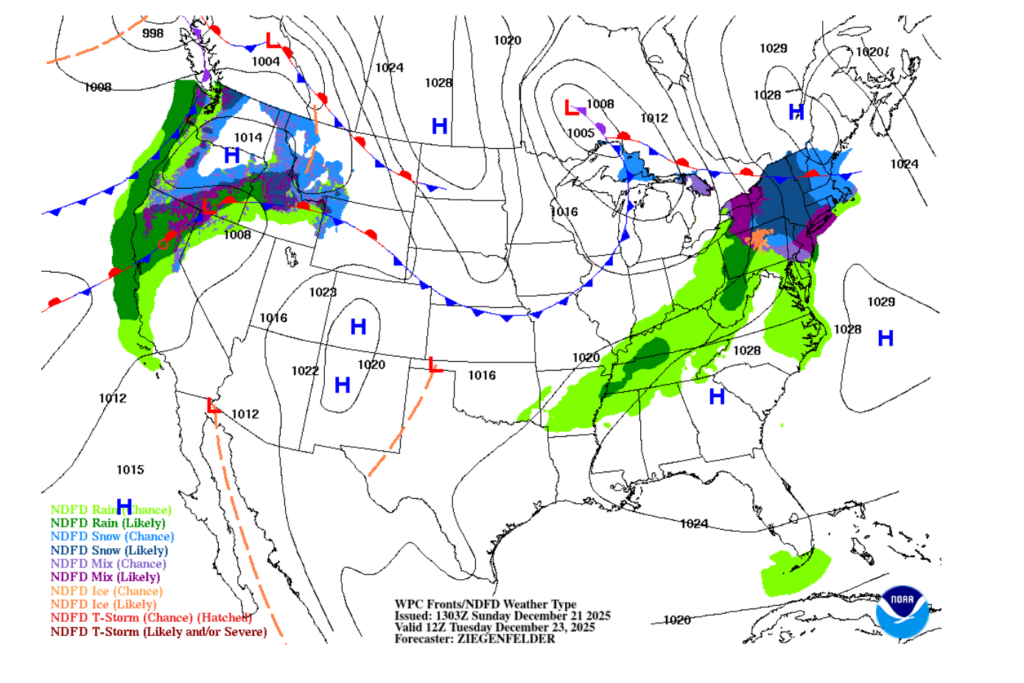
Now, comparing today’s map to Tuesday’s surface analysis, we can see the region is under the influence of high pressure.
Christmas is almost here, what does the weather have in store?
We are still looking at a warmer-than-average Christmas week, with high temperatures ranging from the mid-60s to mid-70s and low temperatures in the upper 50s to low-60s. There is not much variability in the high and low temperatures due to the moderating high-pressure system. High-pressure systems can be pesky and tend to stick around for a while, so the time frame for warmer temperatures not unusual!
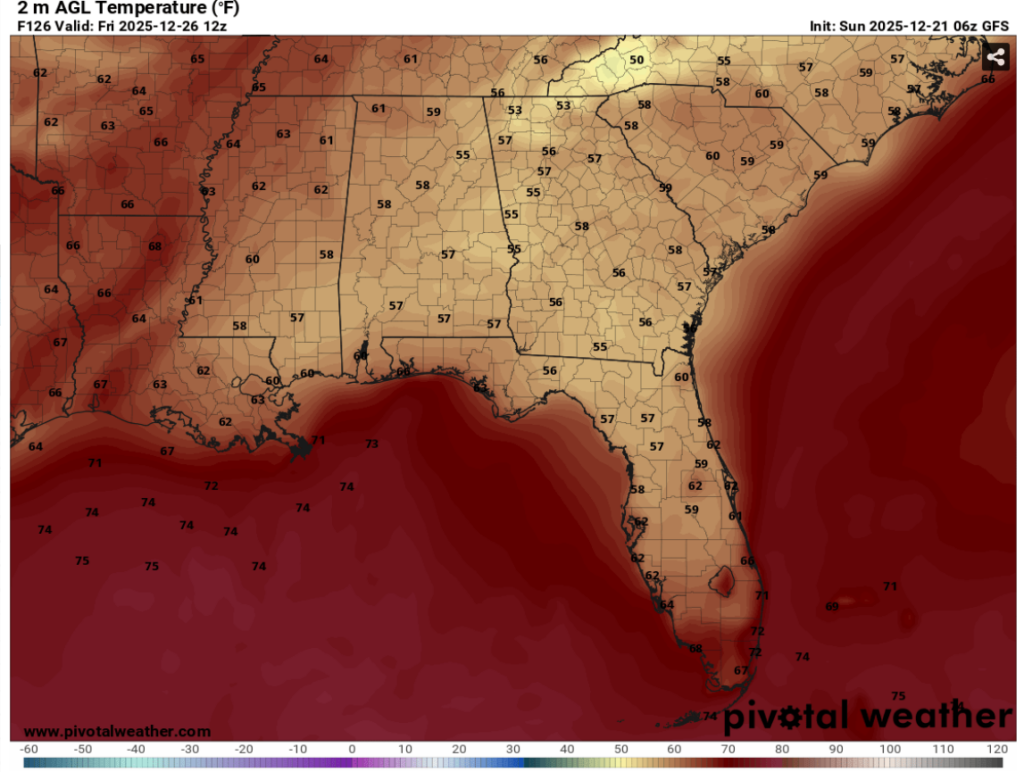
These temperatures are representative of what is in store for the next seven days. High temperatures are expected to be in the range of upper-60s to mid-70s, with lows in the upper 50s to low-60s.
The models are currently in disagreement about the timing of the next system that could produce rain for the region. Some models have the timing as early as Friday night, and others have the timing on mid-day Sunday.
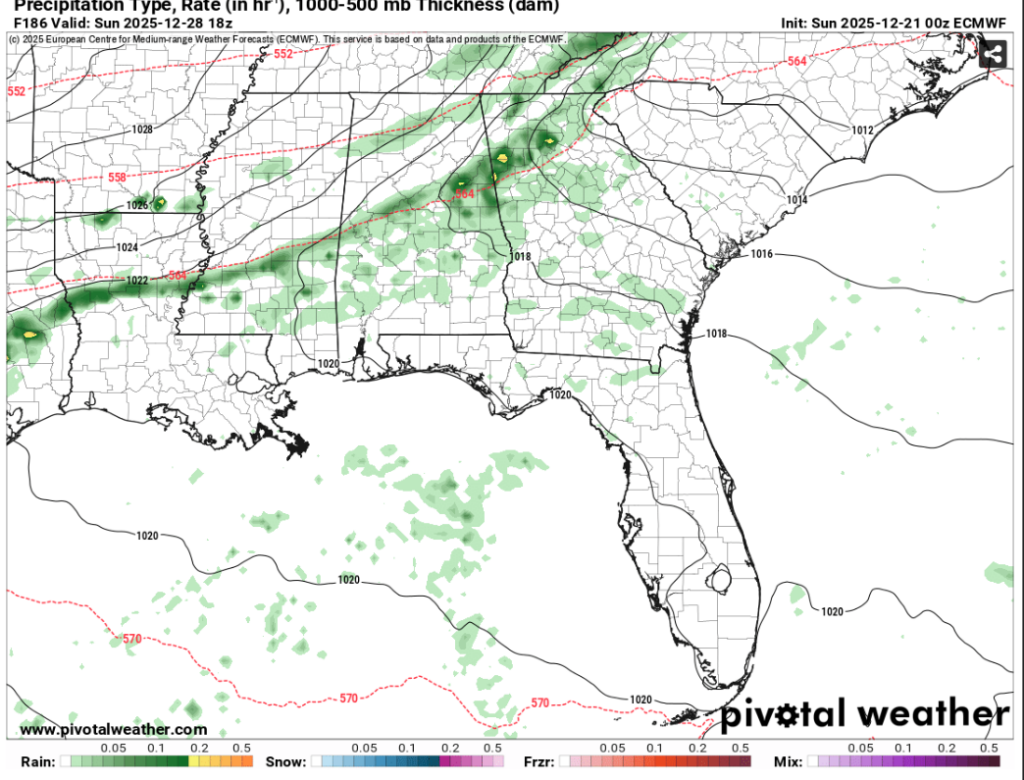
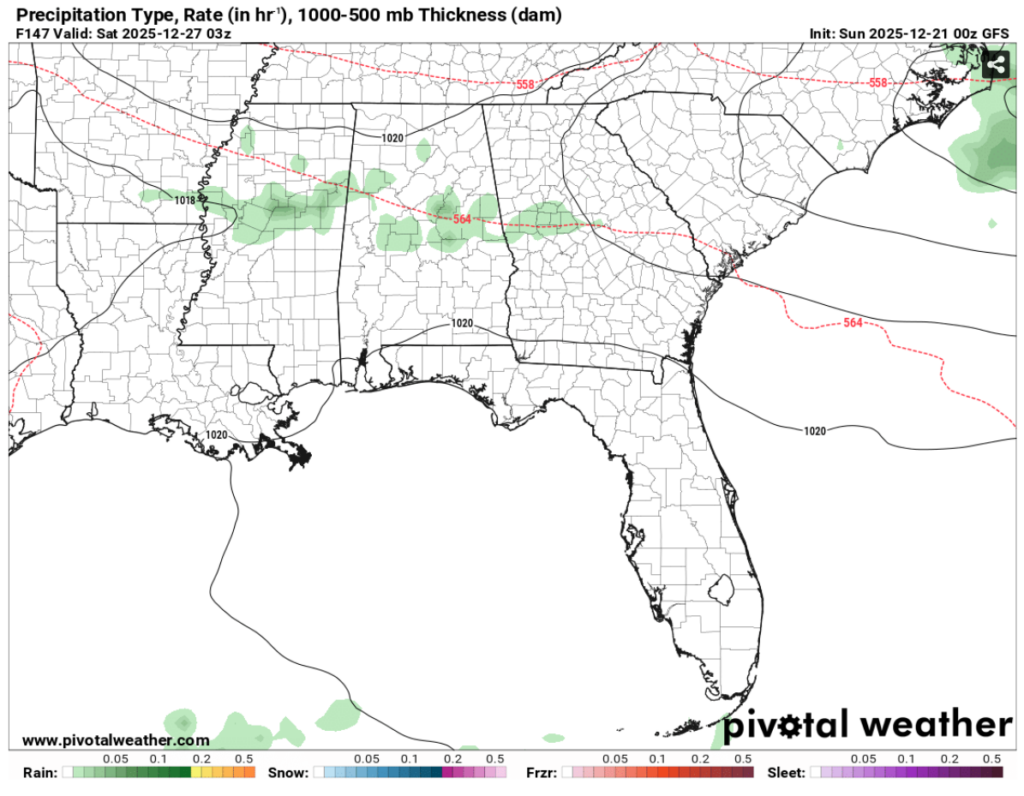
The ECMWF has better timing for the system, in my opinion, while the GFS seems to be underestimating the chances of rain. We are still a little far out to pin down the exact timing of the system, but we will have more updates.
Just keep an eye on things if you have any after-Christmas travel plans!
New Year’s and beyond:
As referenced above, we are watching the low-pressure system at the end of this week. Let’s take a look at the ensemble clusters to identify an overall trend.
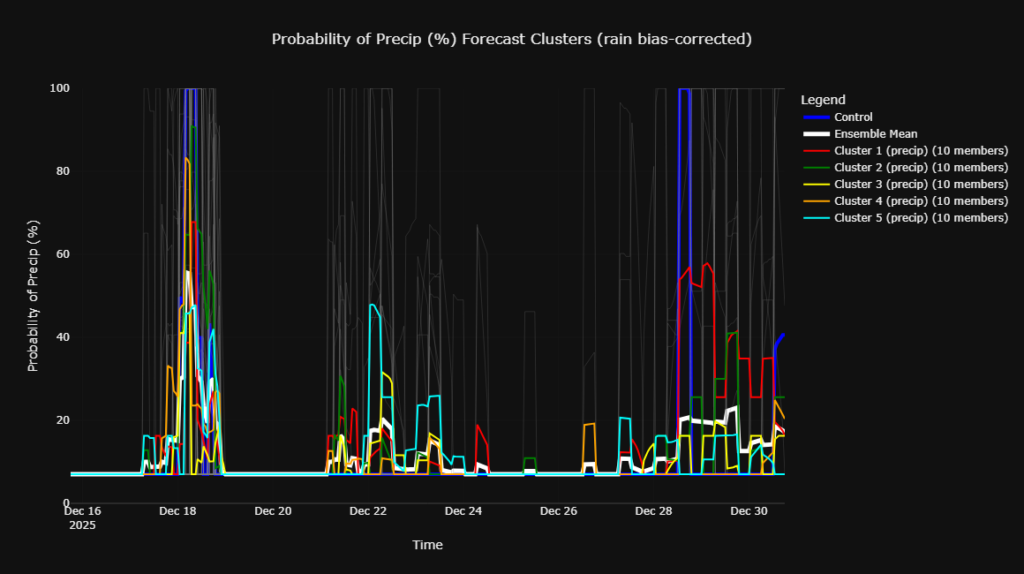
These plots can be confusing to look at, so let’s break it down. Looking at December 28th and beyond, we can see a lot of our clusters increase in the probability of precipitation. This means a large portion of the models used within the ensemble agree that there is a higher chance of precipitation during this time.
Remember how I said the timing of the first system is a little bit up in the air? Well, we can see that here as well. Looking at December 26th, we can see the spike in some of the members, not a lot, but a noticeable amount. So, we will keep an eye on this system and its timing.
Let’s look a little further out at our temperatures!
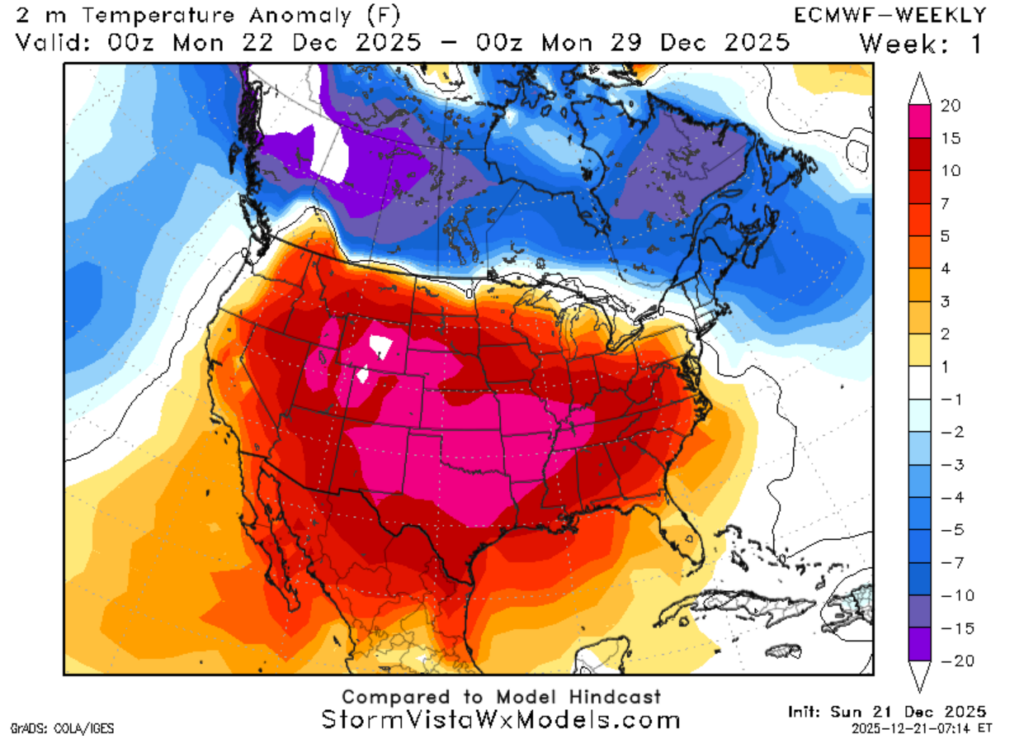
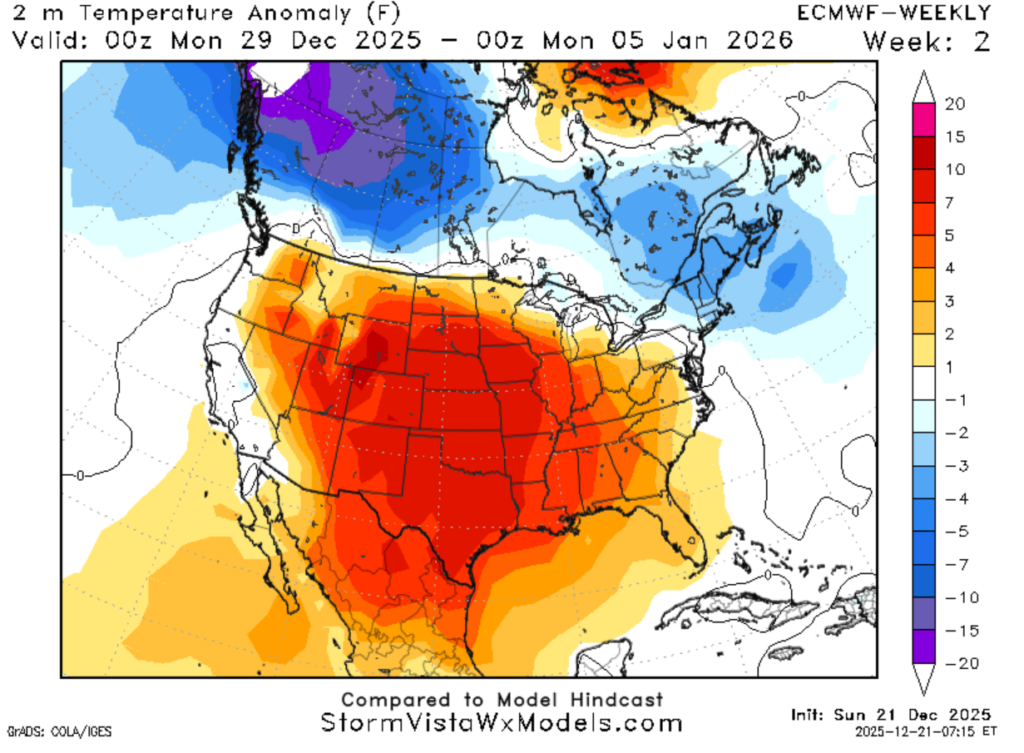
Comparing these two maps, the one on the left is for Christmas week, and the one on the right is for the week after Christmas and into New Year’s. The map on the right is cooler! Yay!
Now, these are temperature anomaly maps, meaning they are comparing the predicted temperatures for each week to the 30-year climatological average. So, instead of 15 degrees warmer than average like we are on Christmas week, we will only be 5-7 degrees warmer than average.
A win is a win, right!
What about precipitation? Let’s do the same breakdown!
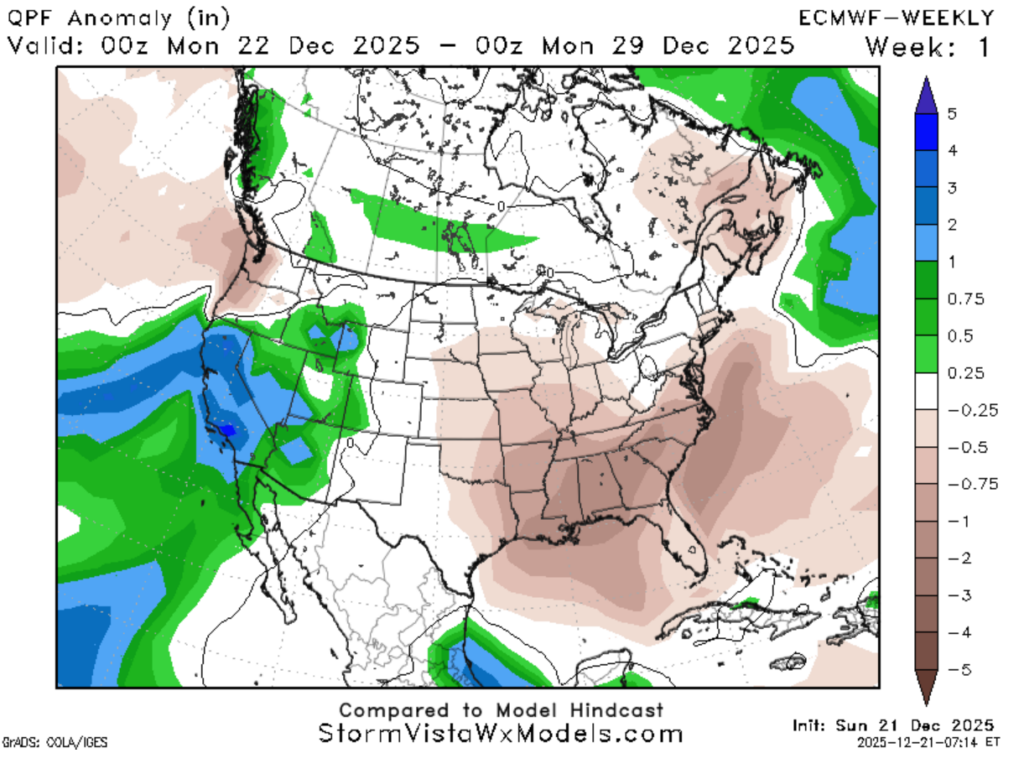
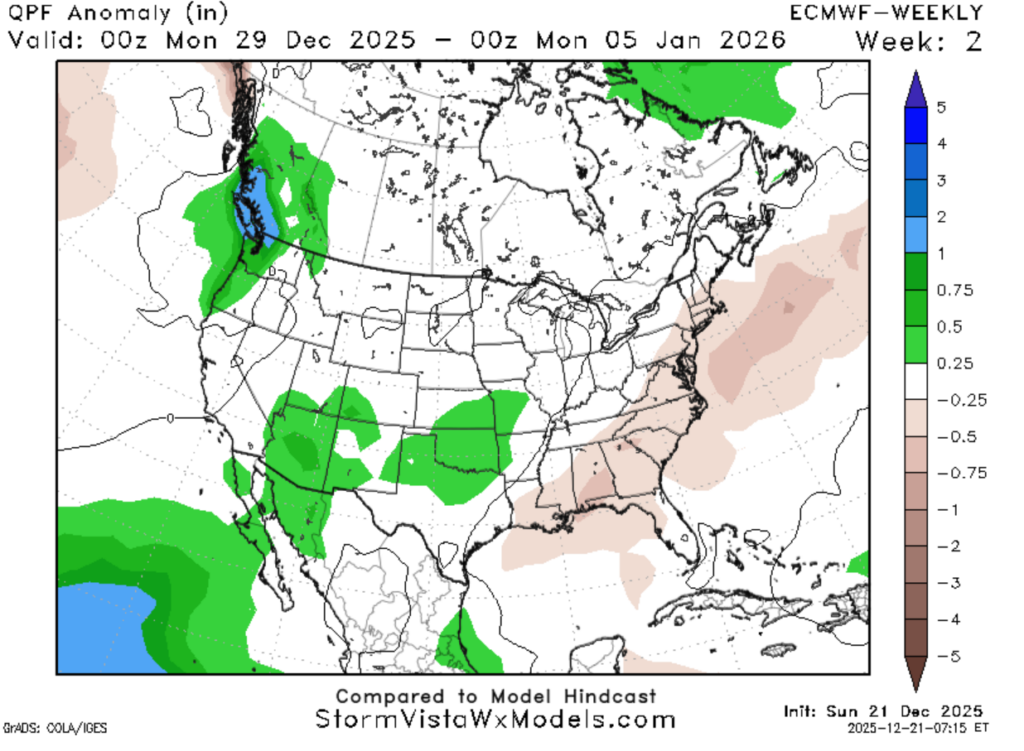
We are looking at the same two timeframes, but now we are showing precipitation anomalies. It is the same concept as the temperature anomaly, but for precipitation! So, comparing the amount of precipitation within these weeks to the 30-year average.
Looking at Christmas week, we are at -1 inch, meaning we will receive about an inch less of precipitation than the average. Looking at the next map, we are only -0.25 inches less than the average. Within this timeframe, December 29th to January 5th, we will likely be receiving more precipitation.
The first week of the year:
Looking ahead to the first week of January, we are coming out of this stubborn ridging pattern. The ridging pattern that is associated with high-pressure systems, warm temperatures, and moderate weather.
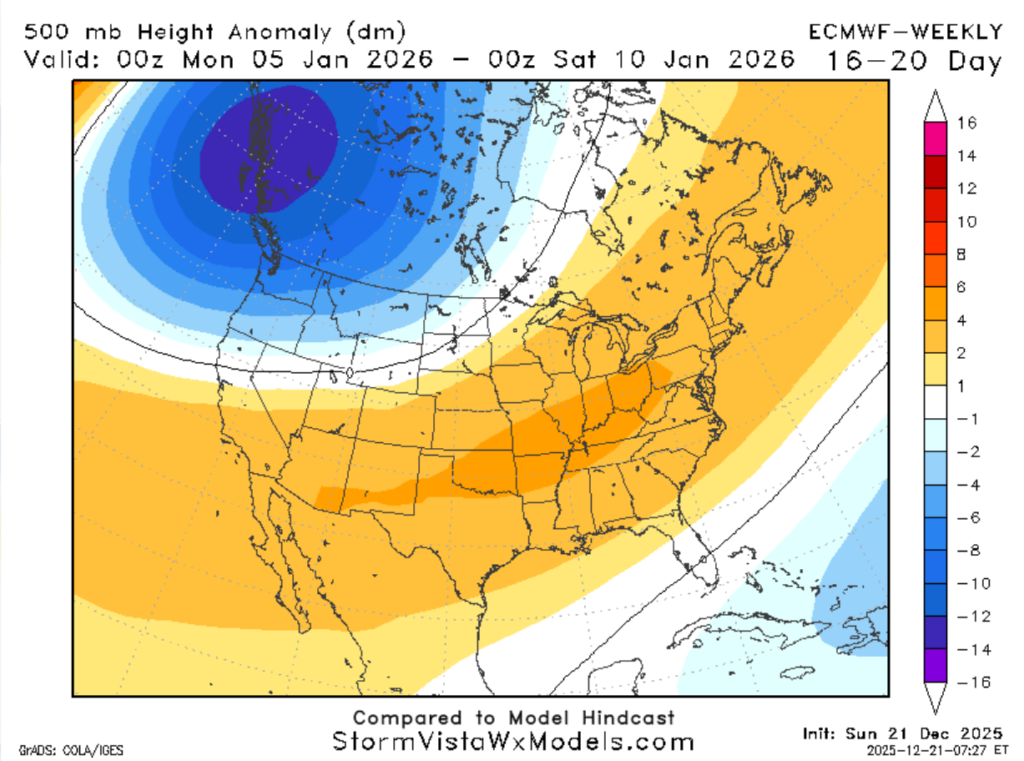
This map is the 500mb anomaly; it is showing the transition from the harsh ridging we were experiencing into a more troughing pattern. We can see the trough, or the “dip” in the heights around the Pacific Northwest. With this new pattern, comes more chances for precipitation and cooler weather!
Let’s use teleconnections and clusters to bring it all together. Teleconnections are the governing global processes for the weather and climate. They allow us to recognize patterns, for instance, a negative Eastern Pacific Oscillation (EPO) means we could see cooler temperatures.
The EPO, is associated with the pressure patterns in Alaska.
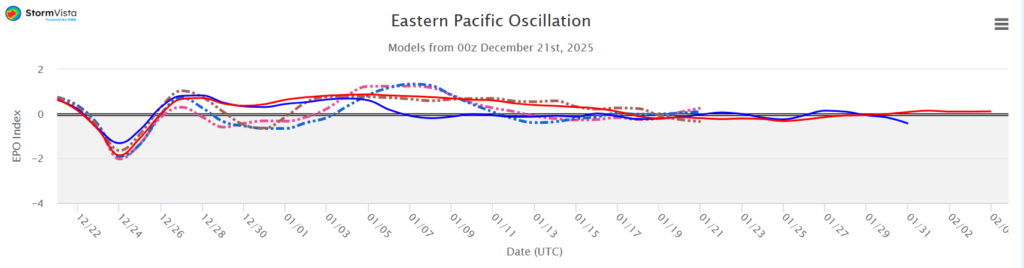
Shown in the graph above, there is a dip in the EPO around Christmas Eve; a negative EPO means cooler temperatures, but we are not seeing these cooler temperatures. Why? The teleconnections are based on very broad-scale motion, while temperatures at any geographic location are based on many factors, so while the teleconnections help identify a pattern, they should not be taken as absolute fact.
We can see after this dip, the EPO becomes pretty neutral, signaling average temperatures.
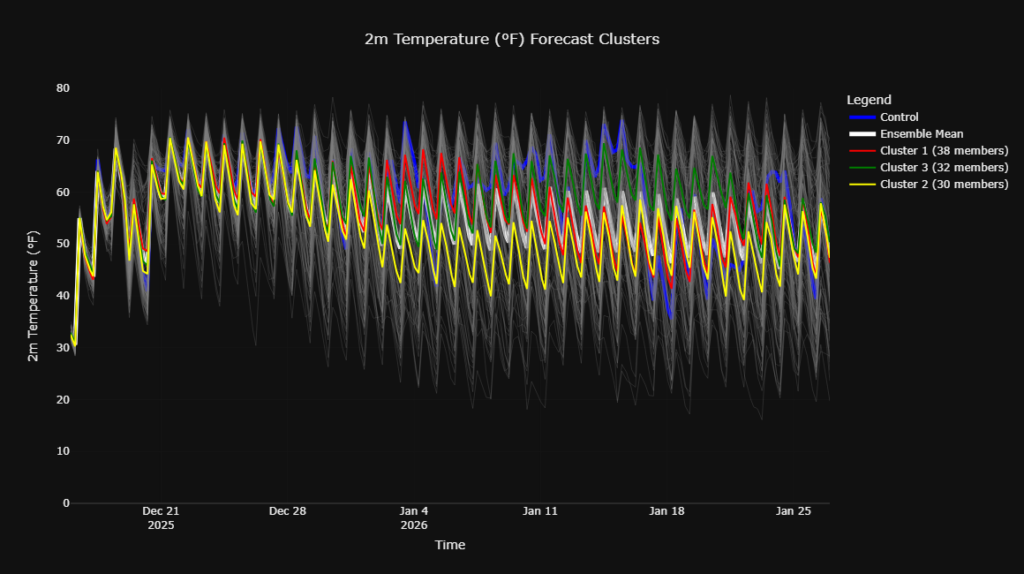
Looking at the ensemble clusters, we can see that there is a slight decrease in the clusters, but nothing major.
Around January 4th, we see a lot of the members start to trend cooler. This is in agreement with the 500mb anomaly map showing us moving into a more trough-like pattern.
Lastly, let’s look at precipitation!
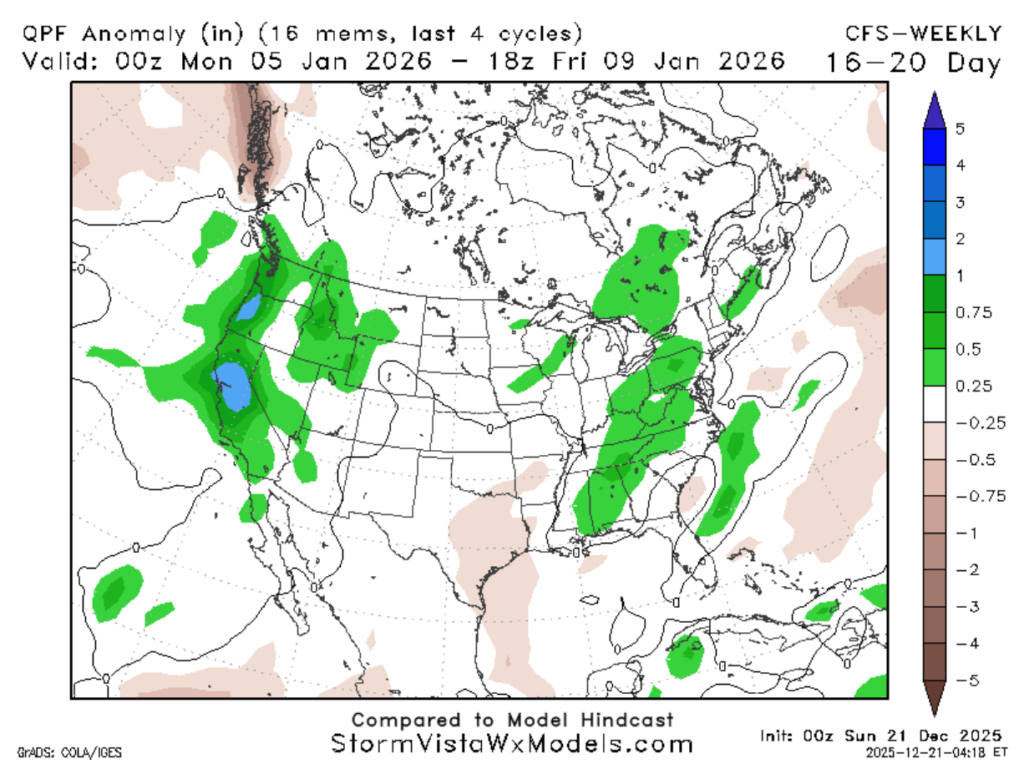
Rain! This map shows our chances of precipitation in the next 16-20 days are 0.5 inches above the average. This is a big change from Christmas week, and likely due to a new upper-level pattern arising.


