I’ve heard from a good number of folks that have said, “My creek is more full today than any other time since I moved here in the 80s!” or “My pond wasn’t even this full fro the floods in 2016!”
And a lot of you guys picked up a lot of rain! Take a look at some of these rain gauges you guys sent over!
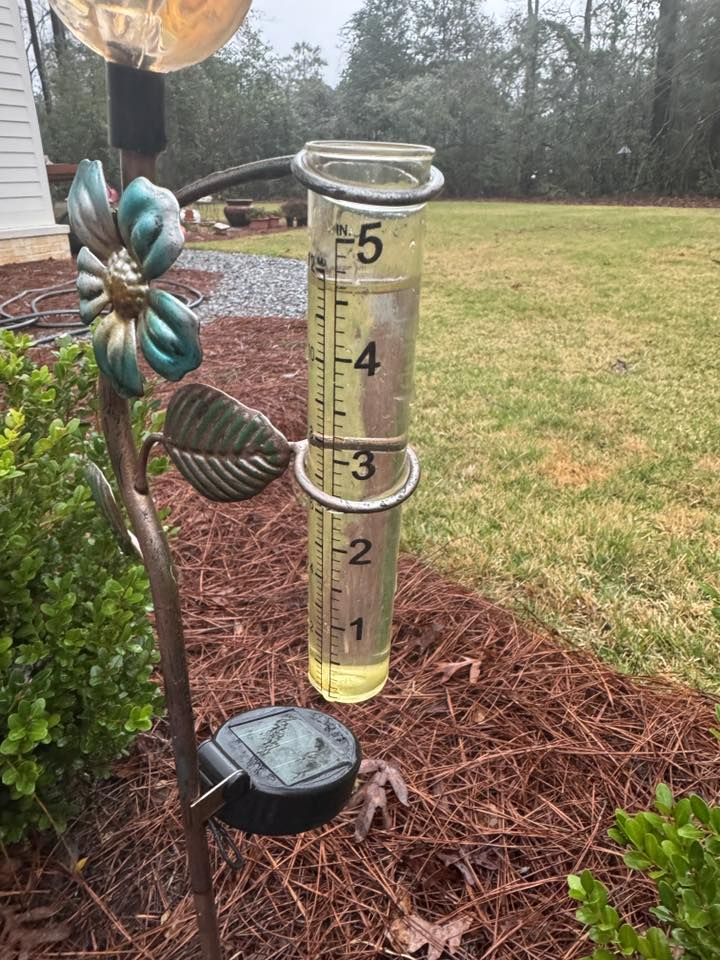

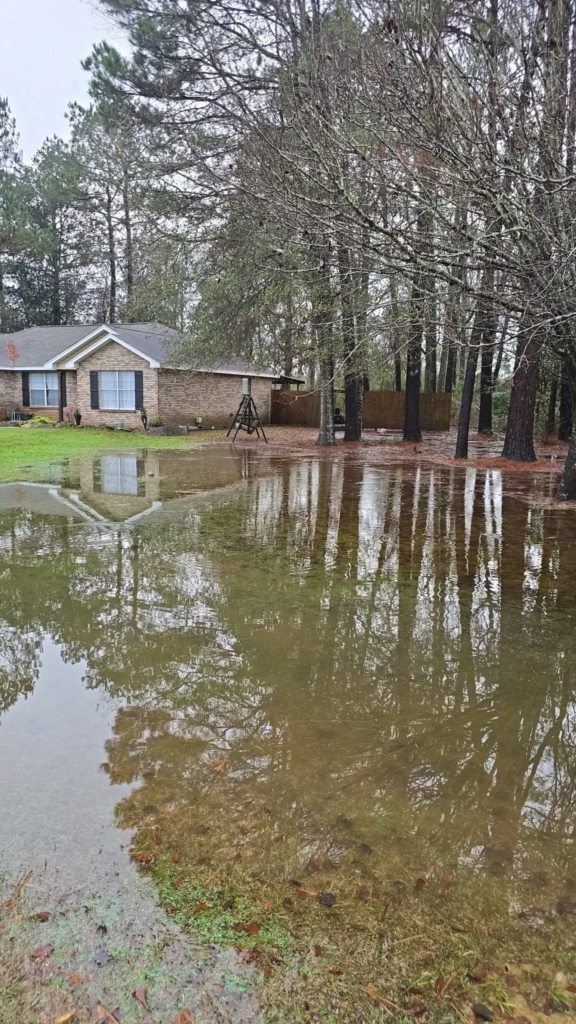
Well, three gauges and one overflowing pond.
While saying, “this is more than I’ve ever seen!” may be for specific individual spots, I wanted to see if it was true for the whole area. And I wanted to see if the higher water levels in the streams and ponds would last as long.
Luckily, I partnered up with Meteomatics a few years ago to bring you guys some really cool data (as well as our clients) and this is the perfect chance to “show it off” so to speak…
THE LAST FEW DAYS
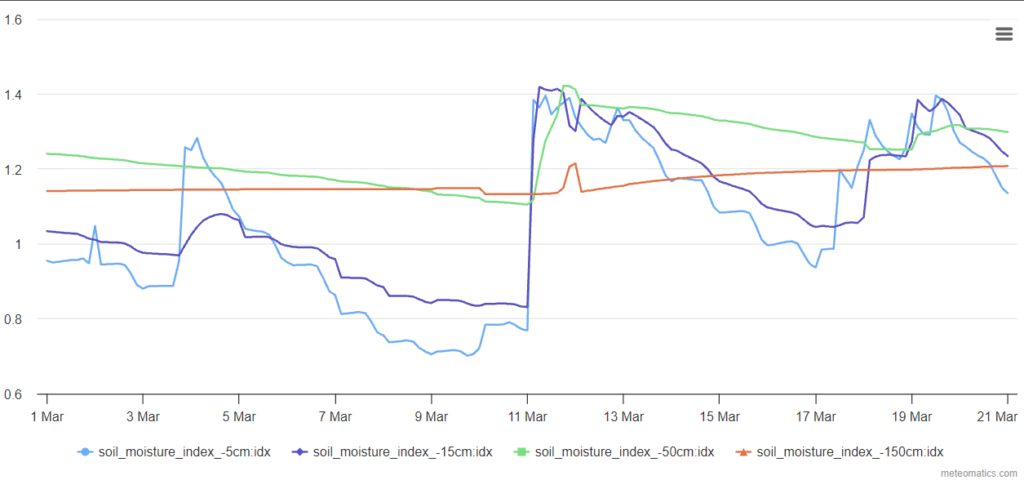
So, first, let’s look at the volumetric soil moisture
Meteomatics data for soil moisture indicates the wetness of the soil. This index is computed using the permanent wilting point (0, no available moisture at all) and the field capacity (1, overflowing with moisture), which both depend on the geographical location (soil type). Note that the index can exceed 1 during and after rainfall events. The soil moisture index is available for 4 depth levels.
We can look backward and forward with this data.
Notice our big spike during the rain yesterday and today. We jumped from the 0.6-0.8 range up to 1.3-1.4. Meaning we jumped from about “70% of capacity” to “130% of capacity” real quick. And as many of you know a drier soil – at first – can’t soak up moisture quite as well. So the immediate reaction is for the water to run-off into local waterways – including streams, creeks, rivers, ponds and lakes.
And it will fill those up quick before the water starts to seep in.
In fact, when you overlap the estimated precipitation on top of the soil moisture, you can see exactly how quickly the rain translates to run-off
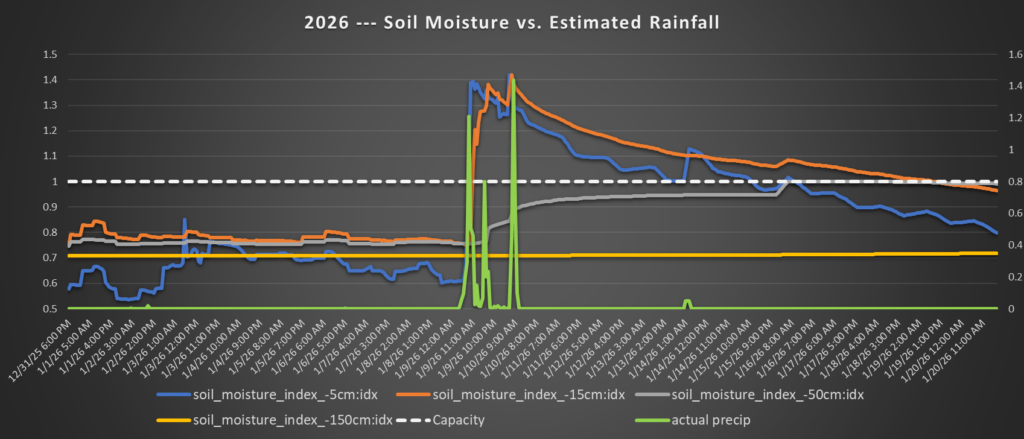
The top 15cm (about 6 inches) of soil was saturated by midday yesterday given how hard the rain was falling and how long it fell. Fromt hat point on, we were talking about run-off or water seeping (slowly) to lower soil levels.
You can see the how the 50cm (about 19.5 inches) deep soil moisture line starts to creep up after that first batch of rain.
And, interestingly, you can see how the next two rounds across the area (averaged, of course, some of you guys saw multiple rounds of rain) didn’t do much to the top 5cm of the soil, because at that point everything was just run-off.
But we have plenty of capacity for extra water to seep deeper into the soils with the field capacity at 50cm and 150cm running at 70% to 80% of capacity.
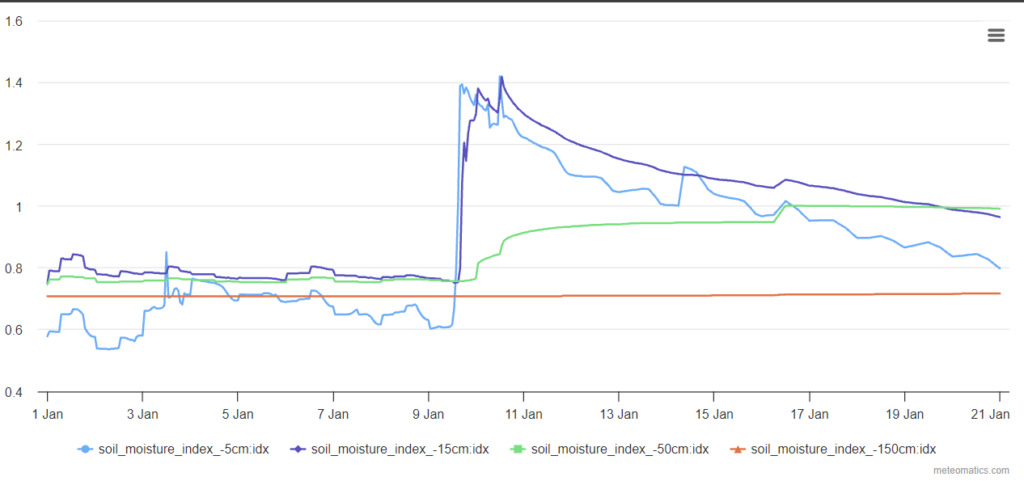
BACK IN 2016
Some of you guys may recall the March 2016 flooding for parts of the area. It was a similar event, atmospherically. We had a little boundary for along some severe storms that moved in earlier than anticipated. Thsoe storms had a few tornado warnings with them (if memory serves me) and then they just kind of parked there. And a cold pool set up.
And we get dumped on.
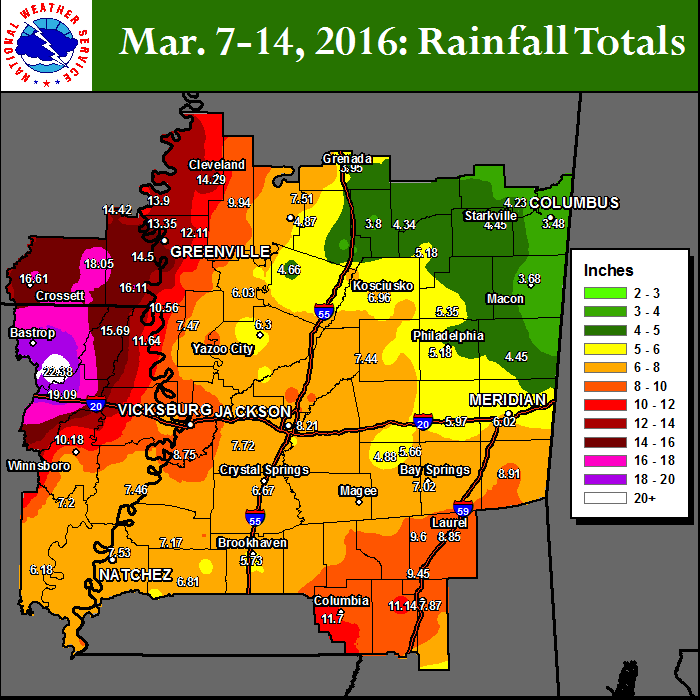
This was a bit of a double-decker system for the region, but for us locally, our heaviest rain set up with a bit of a low-level wind field converged and ran through the cold pool, setting up a train of rainfall (visually, it looked a bit like a lake effect snow band) for portions of the area.
What did that day look like on the same charts?
Note how “full” the soil moisture was at lower depths. This is what we call “antecedent conditions” in the weather world. It is a tidy was of saying, “the way things are when all of this riff-raff gets going”
We had soil moisture capacity at greater than 100% at 50cm and 150cm. And we were around 80% full at 5cm and 15cm deep. That means there was not a lot of space for any rainfall to go once it fell – except into the streams, ponds, and then rivers to be carried out to the Gulf.
Looking at the same comparison between rainfall and soil moisture, we can see how quickly the soil rainfall pushed all depths being measured to “above field capacity” levels.
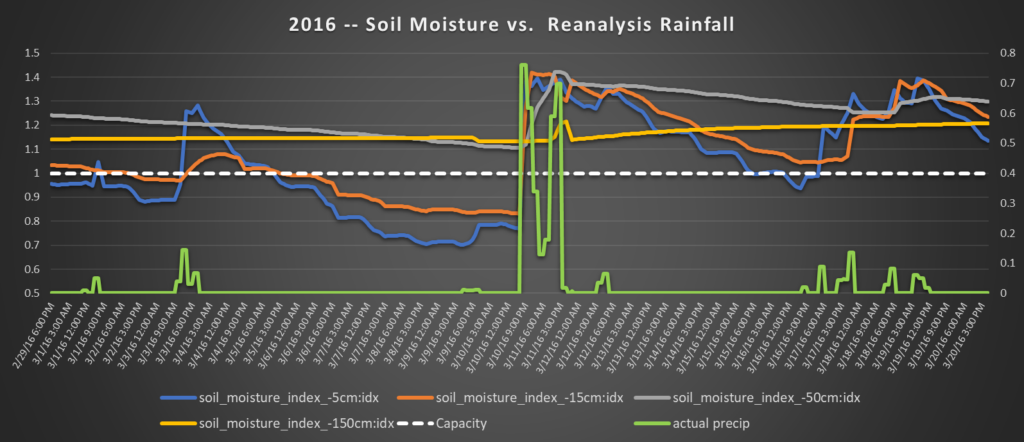
And the rainfall event in 2016 was much longer for the areas that got rain. They were fewer breaks between the rain and hourly rainfall rates were between 0.5″ and 1.0″ per hour for the better part of a full day.
This is why the rivers stayed full for weeks after those floods. Because not only were the soils full of water, but we kept getting rainfall events moving into and through the area.
COMPARING 2026 TO 2016
This was a muhc punchier event. We had multiple rounds of rain where the rain fell heavier than it did in 2016. But there were also decipherable breaks between the different rounds of rain with this go-around, compared to 2016 when it just kept raining and raining and raining.
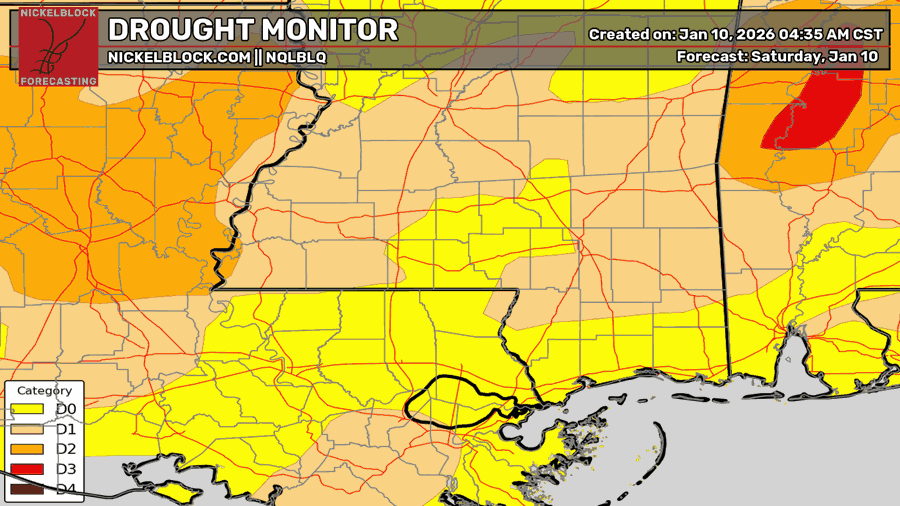
On top of that, the soils today were much drier than they were back in 2016. In fact, right now a bi chunk of the area is in “drought” according to the Drought Monitor.
That means while more of the rain started as “run-off” a bit faster with the drier soils, but once the soils were moistened up, they had the capacity to hold more rain than they did back in 2016.
All of that being said, it means the water should recede faster during the next few days than back in 2016 even though, we may have actually tallied about the same amount of “total rainfall” across the entirety of our area during this event as in 2016.


Let’s see what the drought monitor shows the next time it comes out. I’m thinking that the graphic you have shows a reading before the rain we received this past Friday (9th) and Saturday morning (10th). I’m interested in seeing what it shows for our (Jones County) area.