Hey everyone! As we head into severe weather season, I wanted to update you all on the new severe outlooks from the SPC, which include cleaner graphics and some changes to how storm intensity is shown within the outlooks.
Before you read on, just note that the graphics I’m sharing below are not current or real outlooks. They are only examples, which is why the dates on them are not current.
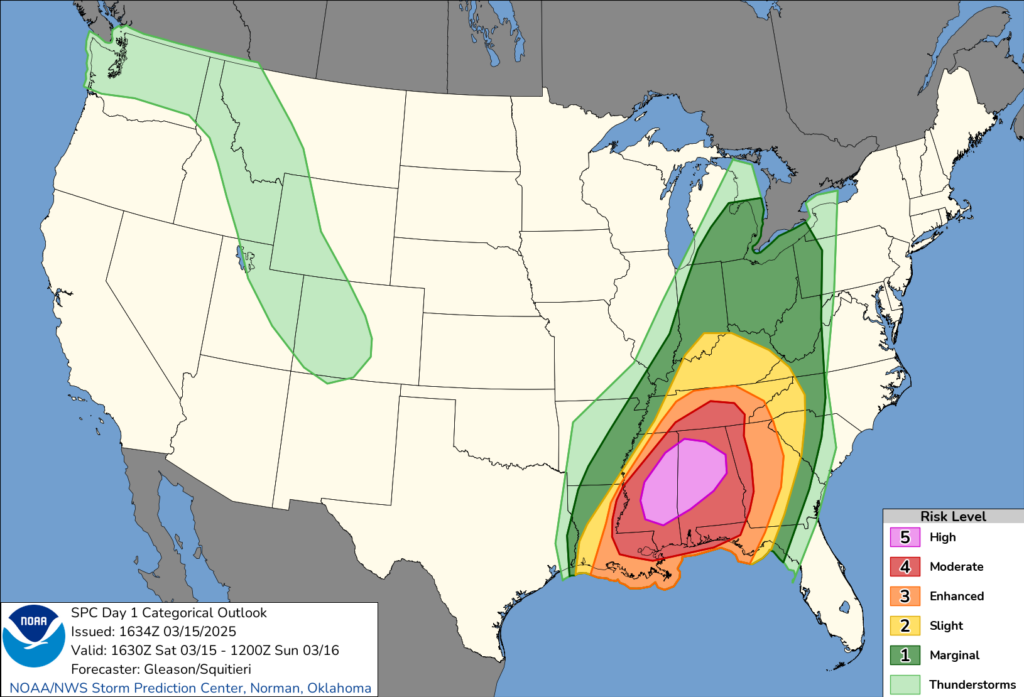
If you’ve looked at an SPC outlook in the past few days and thought it looked a little different, you’re right.
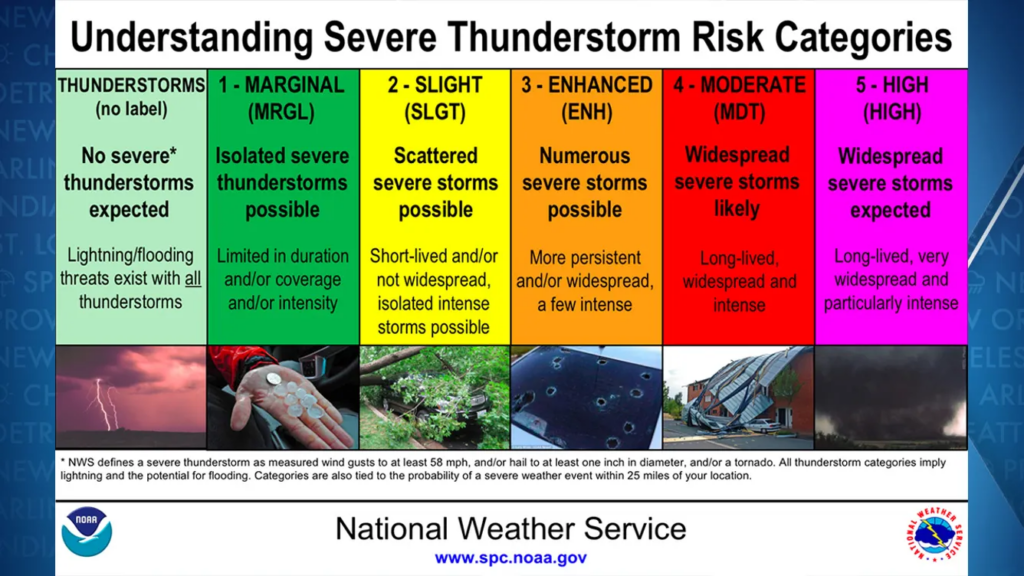
The overall categories are still the same, so you will still see Marginal, Slight, Enhanced, Moderate, and High Risk. That part is not changing. What is changing is the added detail within the outlooks, along with the updated graphic style. No more blurry maps or weird arrows! It’s more visually pleasing, in my opinion.
One of the biggest changes is the addition of Conditional Intensity Groups, or CIGs. These were added to the Probabilistic outlooks and the tornado, wind, and hail outlooks to show not just where the threat is possible, but also how intense it could be if it occurs.
Tornado Outlooks
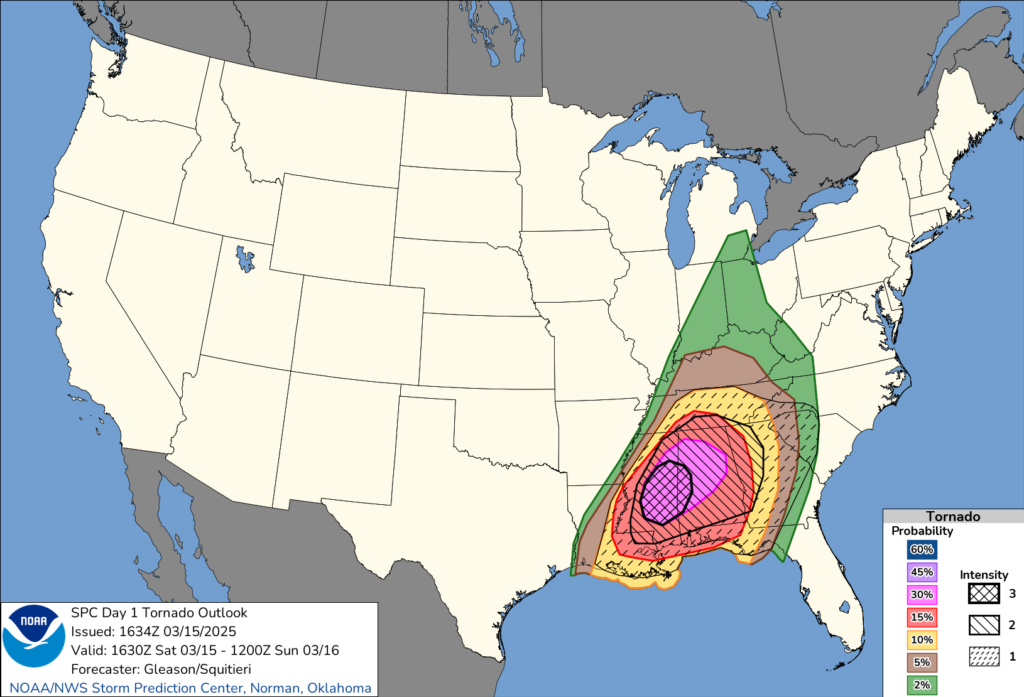
The new tornado outlooks can now show a CIG to highlight higher-end potential. That matters because not every severe setup looks the same. Some days may have a broader severe threat, while others may have fewer storms overall but a greater chance that any storm that forms could become intense. These new CIG labels help show that difference more clearly.
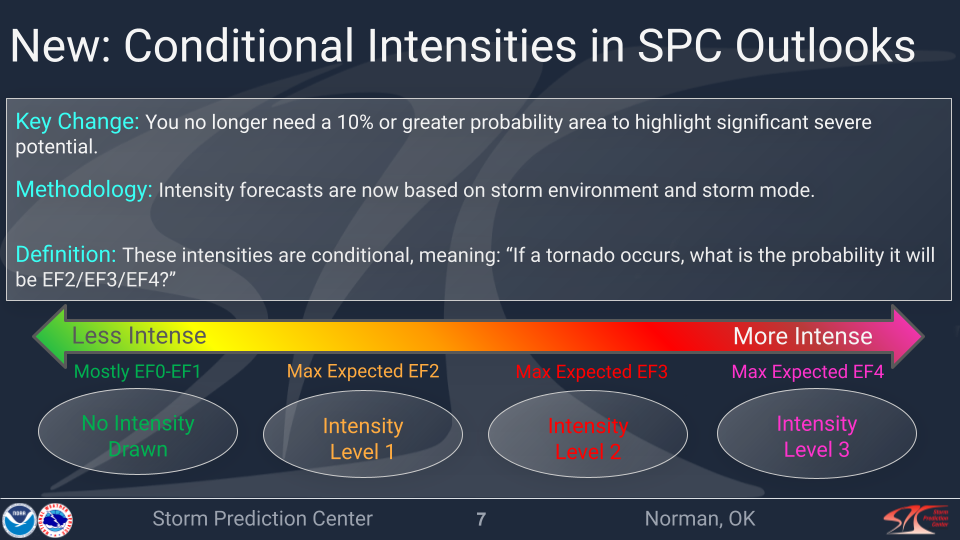
For tornadoes, the new outlooks use intensity tic marks 1 through 3 to show increasing conditional intensity if a tornado occurs. In general, no intensity tic mark points to mostly EF0 to EF1 tornado potential, intensity tic mark 1 points up to EF2-strength tornadoes, intensity tic mark 2 points up to EF3-strength tornadoes, and intensity tic mark 3 highlights the highest-end setups, up to EF4+-strength tornadoes, though a stronger tornado is still possible at any category. The old hatching system had the same hatches for EF2 to EF5, which are drastically different beasts.
Wind Outlooks
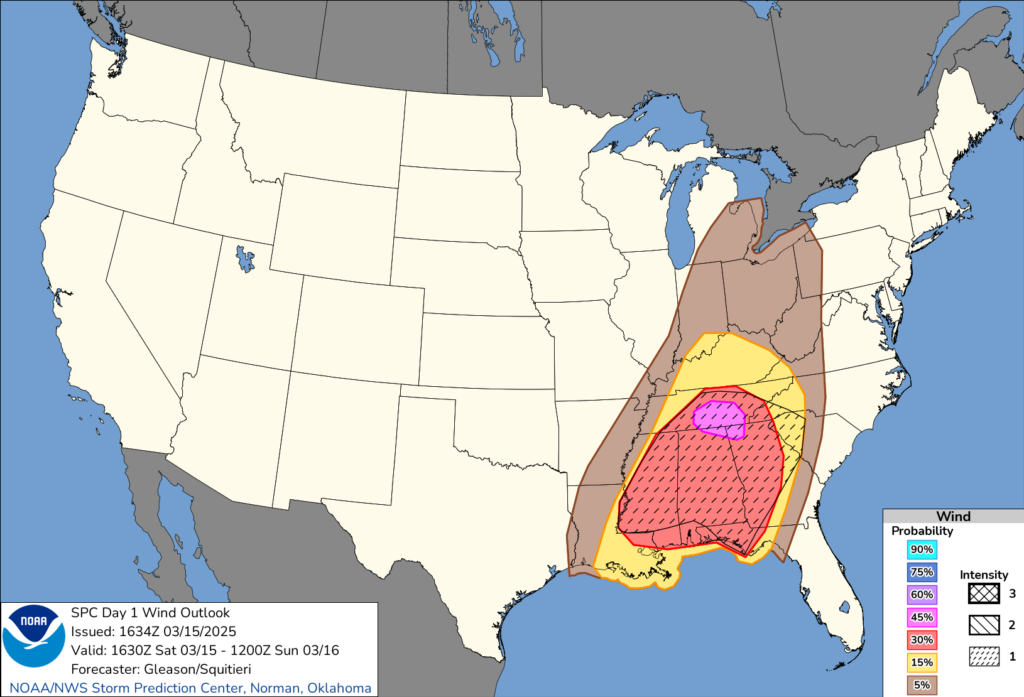
Wind outlooks now also include intensity levels, which help pinpoint where the highest wind gusts could occur. They have also added the option for a 90% probability of severe wind gusts! Instead of seeing only a highlighted, significant, severe area the old way, or just a single hatched zone, you may now see one of these CIG labels, which will provide more context.
For wind, the new outlooks also use intensity tic marks 1 through 3 to show increasing conditional intensity if severe wind occurs. In general, no intensity tic mark points to mostly winds under 75 mph, intensity tic mark 1 points to gusts over 75 mph, intensity tic mark 2 points to the potential for a bow echo or derecho with gusts over 85 mph, and intensity tic mark 3 points to a high-end derecho setup with gusts likely over 95 mph.
Hail Outlooks
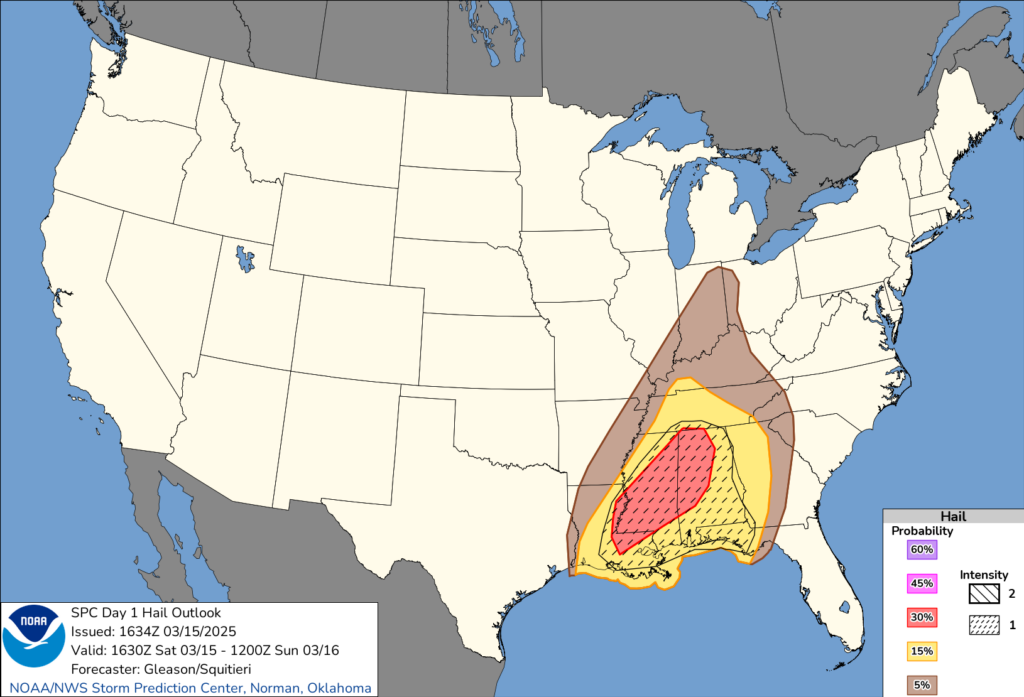
For hail, the new outlooks use intensity tic marks 1 and 2 to show increasing conditional intensity if hail occurs. In general, no intensity tic mark points to mostly hail under 2 inches, intensity tic mark 1 points to hail over 2 inches, and intensity tic mark 2 points to hail over 3.5 inches. You don’t wanna be under that one!
Final Thoughts
Although the SPC has added these intensity levels for each risk category, it’s important to note that a Slight Risk remains a Slight Risk, an Enhanced Risk remains an Enhanced Risk, etc. The categorical risk zones have not changed in color or name. The main difference now is that the outlooks do a better job of showing when a setup may have higher-end potential if storms develop.
At first glance, the new outlooks may look a little more complicated, but once you get used to them, they should give a clearer picture of the severe threat.
As we head deeper into severe weather season, we’ll keep breaking these down when needed, so they’re easier to understand whenever severe weather is on the table.


