The pattern is becoming more favorable for severe weather across the region as we move through the next 7-to-10 days. We have one shot on Wednesday/Thursday of this week and then again on Saturday/Sunday of this next weekend.
REMINDER: IF YOU HAVE AN ANDROID PHONE, YOU LEARN ABOUT & DOWNLOAD OUR NEW APP BY TAPPING HERE! IF YOU ARE AN APPLE USER, THAT APP WILL BE AVAILABLE SOON. IT IS STILL CURRENTLY, IN DEVELOPMENT.
A quick note about the general pattern before we move into the specifics — so everyone can monitor what to ‘look for’ when it comes to a pattern that produces severe weather. When we get severe weather across the region it is generally when there is troughing to our west and ridging to our east.
The troughing is indicated by the black arrows pointing down and the ridging is the black arrows pointing up. These maps are broken out into different points in time during the next two weeks. Notice that the maps look pretty similar, even with their minor differences.
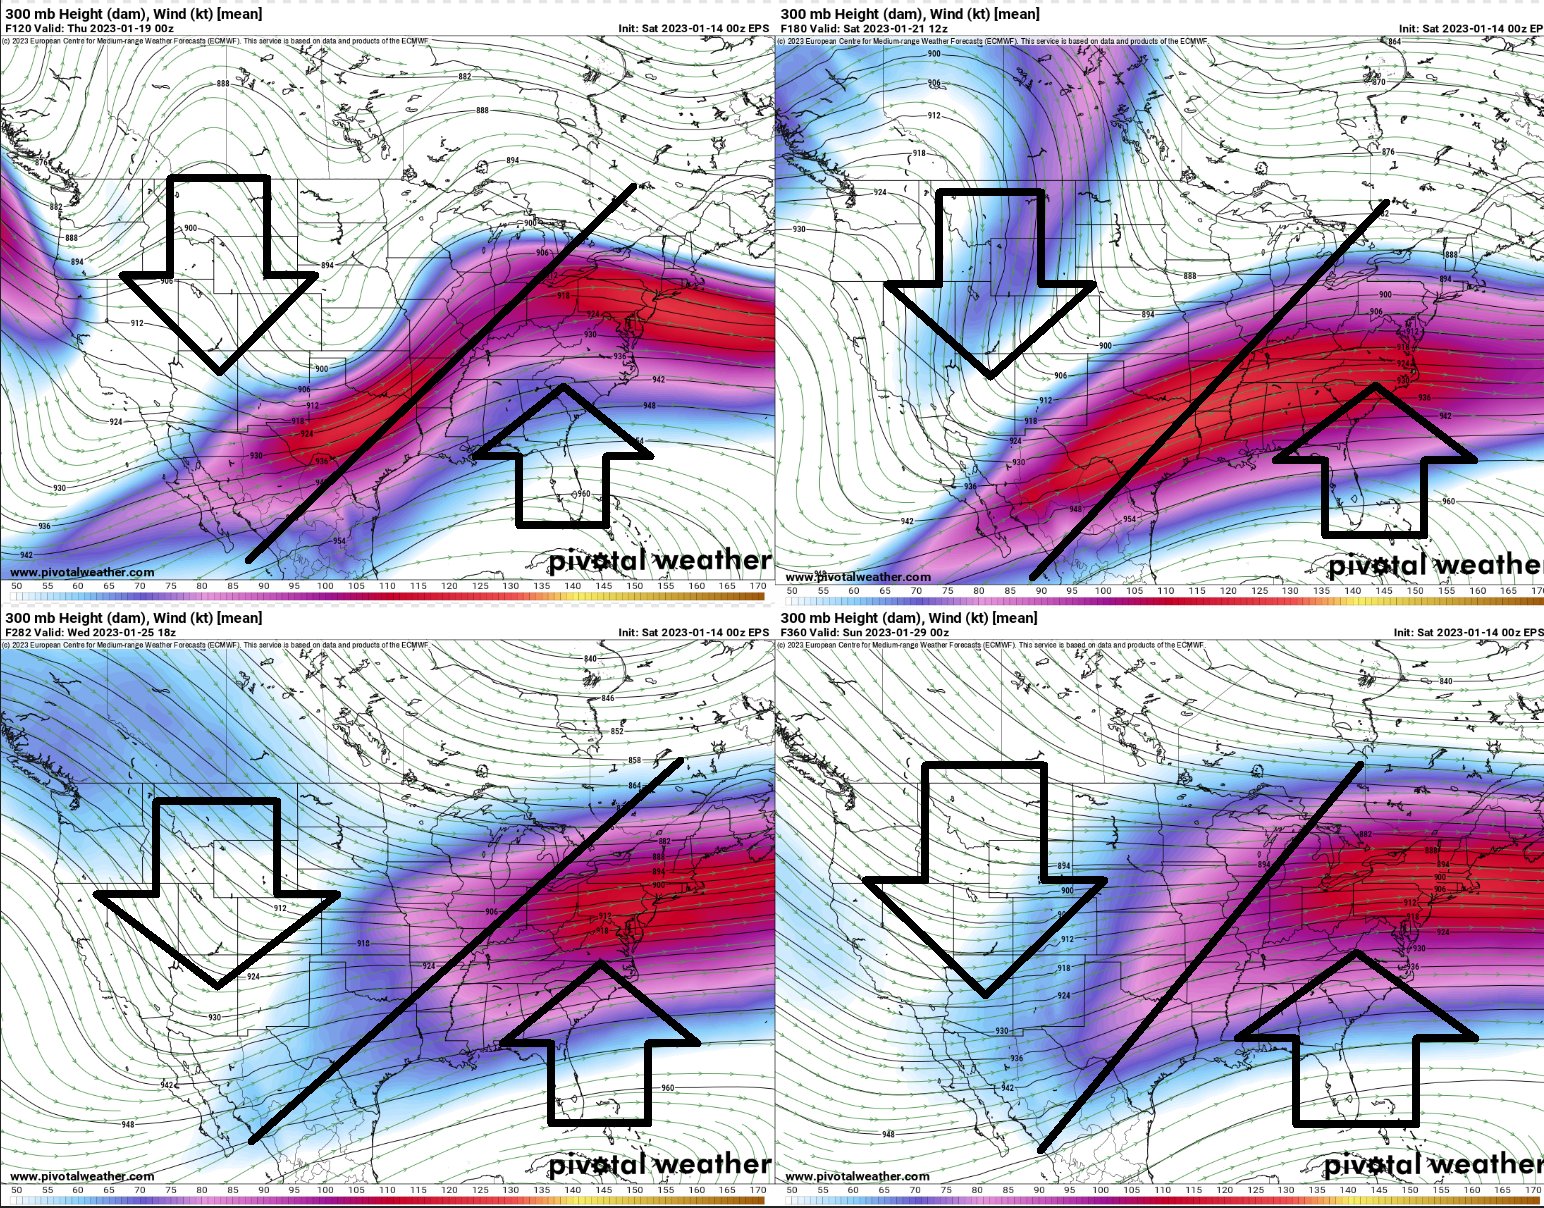
This sets up a, very general, north wind to our west and a south wind to our east. And it moistens up our atmosphere with plenty of Gulf of Mexico air while also shoving a bunch of cooler, drier Canadian air nearby, too.
The clash of these two airmasses means….. occasional storms! And the potential for some severe weather!
JUMP TO A SECTION
FROM THE SPC
And that is where we sit right now looking out at Wednesday/Thursday. The Storm Prediction Center has already highlighted out area with a Slight Risk for severe weather.

From the SPC:
An active upper pattern is expected to continue early next week, beginning with a strong shortwave trough expected to move across the Southwest on D4/Tuesday and into the southern/central Plains on D5/Wednesday.
Strong mid-level flow will accompany this system, spreading eastward and extending from northern Mexico through the Lower/Mid MS Valley and into the Southeast by D5/Wednesday. Additionally, favorable low-level moisture should be in place ahead of the approaching shortwave from central TX eastward into the Southeast on D5/Wednesday.
These conditions will set the stage for potential severe thunderstorms from east TX across LA and into western MS. Expectation is for strong to severe thunderstorms to develop along an eastward moving cold front, with at least some potential for open warm sector development as well. The warm sector development is more uncertain, given the likely cloud cover (and resulting lack of heating/destabilization) and negligible large-scale forcing for ascent. However, even with this uncertainty, the anticipated coverage of severe thunderstorms along the front coupled with the possibility of warm sector development merits the introduction of a 15% outlook area.
Most recent guidance is in better agreement with the evolution of this system as it continues northeastward across the Mid MS and OH Valleys on D6/Thursday. Thunderstorms are possible along and just ahead of the front at it moves across the remainder of the Southeast, but displacement south from the parent system in tandem with marginal thermodynamics should limit the overall severe potential.
Another strong upper trough is forecast to move across the western CONUS on D7/Friday and into the Plains on D8/Saturday. Some severe potential may develop along the Gulf Coast, where the most favorable low-level moisture is expected to exists, but predictability remains too low at this forecast range to introduce any probabilities.
The “warm sector development” they mention above is referencing the potential for isolated, discrete supercells ahead of the front. Those are the ones that tend to produce the most significant severe weather and the strongest tornadoes. Saying that there is ‘uncertainty’ surrounding that means it is something to monitor because model guidance isn’t giving us enough information to make a ‘yay’ or ‘nay’ forecast at this time.
FORECAST DATA
Let’s dive into things. The 500mb map shows the next storm system is actually parked southwest of Alaska right now. It is going to zip across the Pacific and down into the Four Corners region before plopping out to right about where the storm that move through the other day is sitting right now.

As it swings through the Skew-T data suggests that late Wednesday night and into Thursday morning will be the best time to produce severe weather across the region.
That said, I think it is still a bit too far out to narrow down a timeline to say “overnight-only” threat or “morning-only” threat. I think the window for storms is really from about 6p Wednesday night through about 1p Thursday afternoon. Doesn’t mean it will be raining and storming that whole time, it just means I don’t have sufficient data to support picking out a smaller window for a potential threat.

You weather geeks may notice the Skew-T doesn’t look that “scary” in the data. I agree. But I do wonder if the models are simply not handling things well. I tried to dig up old data from the last time things ‘looked like this’ in 2015 (more on that below), but I couldn’t access the data from the NOAA site. But I do wonder if things will be different this time around for a few reasons, but I’ll get to that below.
Before I get to ‘the last time’ data, the data for this time still isn’t as scary when you look at the supercell composite data. Most of the higher values are well off the coastline and out into the central Gulf.

Right now, it looks like most of the potential severe weather is most likely to erupt along a line of storms ahead of the cold front that is set to move through late Wednesday and into Thursday morning.
Ahead of the front, but in the warm sector, as the SPC pointed out, there isn’t currently enough evidence to support a forecast that calls for discrete supercells.
CIPS ANALOGS
Okay, let’s look at past performance. The CIPS Analogs are great for this. And they paint a more robust picture of the atmosphere with a larger area of potential severe weather than the SPC is currently highlighting. Below, the orange shading of 15% tornado risk covers most of Mississippi, nearly all of Alabama as well as parts of Florida, Georgia and Tennessee.
The other map below, showing tornado risk, shows a 5% rights for southern Mississippi specifically.


The maps above are based on ensemble guidance. That is to say, they take one deterministic model then tweak a bunch of the initial weather conditions and let it run 30 different times with 30 different tweaks. It is actually really useful! Because we can’t know all of the weather absolutely everywhere, so making minor adjustments helps us, as forecasters, get a better idea of the possible outcomes given our missing data.
But what does the deterministic model data from CIPS suggest? Also, a relatively robust setup. The Top 15 analogs score between a C and a C+ grade. Not “great” but certainly not “bad” either. On the table below, the “Final” score on the right is out of 15. And the score is based on a handful of parameters (also on the table below).

We can then take the dates on the table above on the left that match up with the scores on the right and plot those days on a map! And plot the severe weather reports and the Practically Perfect Hindcast on the map and we get the maps below.

Notice on 12 of the 15 dates, there was at least one severe weather report across the region. On two of those dats there was severe weather, it was just somewhere else. And one date, Jan 3, 2015, there was no severe weather at all.
Some of you may remember Jan 3, 2015. Most probably don’t. But here is a video forecast from that day: https://www.nickelblock.com/mississippi-severe-weather-discussion-for-jan-3-2015-2/. In fact, the video has the snippet where I use the spreadsheet that eventually turned into the Karrie Meter
But since the vast majority of Top Analogs do include severe weather, lets look at what the data suggests..

The data show that historically, of the Top 15 analogs that nine of those produced at least five severe weather reports across the region nearest to I-20 in Mississippi. With about seven of the Top 15 Analogs showing at least five severe weather reports from Vicksburg, MS to Huntsville, AL and down to about Wiggins, MS.
Underneath that, the tornado threat shows that in those same, general, areas that about five of the Top 15 Analogs show that there was at least one significant and/or one long-track tornado that occurred.


So there is current data to support the potential for some severe weather as well as past evidence to support the potential for severe weather when looking at this upcoming Wednesday and Thursday.
THE BOTTOM LINE
The potential for severe weather exists next Wednesday and Thursday. It looks like storms are most likely along the cold front that is forecast to move through. There is a chance for storms ahead of the front, but right now there isn’t enough to data to give that a ‘yay’ or ‘nay’ in the forecast.
The timeline is from about 6p Wednesday night through about 1p Thursday afternoon. That doesn’t mean it will be raining and storming that whole time, but we don’t have access to any data that supports narrowing the window any more than that 18(ish) hours. As we get closer and get more data, the window for storms will shrink down to about a 5-10 hour window.
The threats include heavy rain, flash flooding, lightning, wind gusts up to 65mph, hail up to the size of quarters, and a few tornadoes (perhaps even a strong tornado).
Now is not the time to cancel any plans or lose any sleep. Just keep tabs on the forecast in the coming days for now. As we get new data, we can refine the forecast.
Also of note, once we get through the midweek stuff, there is a low chance – but not zero – that we play the same song-and-dance next weekend as the next system pushes through.


