“They say its going to be a bad Winter” is something I hear often. But never get a straight answer when I ask “who are they?”
‘you know, the weather people’ is usually what I hear back.
And, don’t worry, my own Mom does the same thing. We’ll be on the phone, and she’ll say, “They’re saying its going to be a bad winter.” And I’m like, “Mom, who says? Because I’m they! I’m a they! And I’ve definitely not said that.”
So, if someone ever tells you, “They’re saying it’s going to be a bad winter” please – I’m begging you – ask “who says?” And see how the person responds. Unless they can cite something specific, don’t trust it.
Okay, that point aside, the Climate Prediction Center has issued a “La Niña Watch” for this winter. The CPC notes that ENSO-neutral conditions are present but that equatorial sea surface temperatures (SSTs) are near-to-below average across most of the Pacific Ocean.
This is important for reasons I’ll touch on later. But a transition from ENSO-neutral to La Niña is favored in the next couple of months, with a 70-80% chance of La Niña during the Northern Hemisphere winter 2021-22.
You can see that temperatures continue to cool off the west coast of South America. During the last four weeks continues to show such cooling.


This will be the second La Nina in a row, if it develops. There is precedent for such a thing occurring in the recent past. It ‘sort of’ happened in 2016-2017 & 2017-2018. But it did occur in 2010-2011 & 2011-2012, for example, La Nina reformed after a strong La Nina the year prior.

This matters because analogs are important when looking at seasonal outlooks. Often times we look back in the past to see how the atmosphere and ocean were interacting to make predictions for the future.
The things I tend to look at include La Nina, Gulf temperatures, Meridional wind, the PDO, Summer atmospheric conditions, and Summer precipitation.
And the regional weighted analogs look like this:

The top analogs have been outlined in bold. These are the years that are a bit more statistically significant.
Of all of the analogous years, here is how those Winter seasons ended:

The data show eight of the 13 analogous years were cooler than average and five were warmer than average. So we can already start to lean toward a cooler winter.
But let’s lay some ground work for a few minutes.
What is La Nina
La Nina is an when the Pacific Ocean waters off the coast of South America run cooler than average. In fact, it is when they are greater than 0.5 degree below average. The atmosphere – globally! – responds to this change. The cooler water temperatures moves the jet stream to different areas and increases the chances that different weather to happen in different areas.
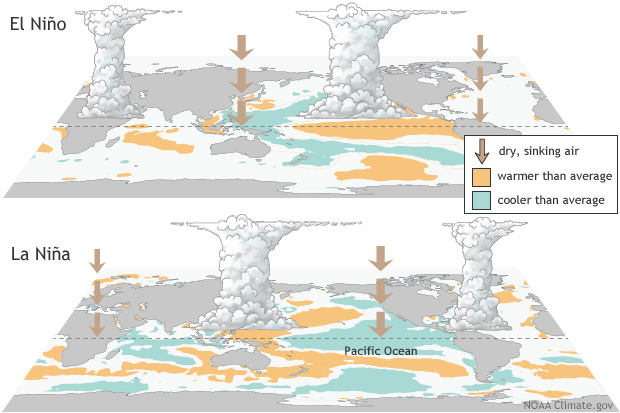
The textbook definition of La Nina from NOAA sounds like this:
La Niña is characterized by unusually cold ocean temperatures in the Equatorial Pacific, compared to El Niño, which is characterized by unusually warm ocean temperatures in the Equatorial Pacific. The graphic below shows the sea surface temperature in the equatorial Pacific (20ºN-20ºS, 100ºE-60ºW) from Indonesia on the left to central America on the right.
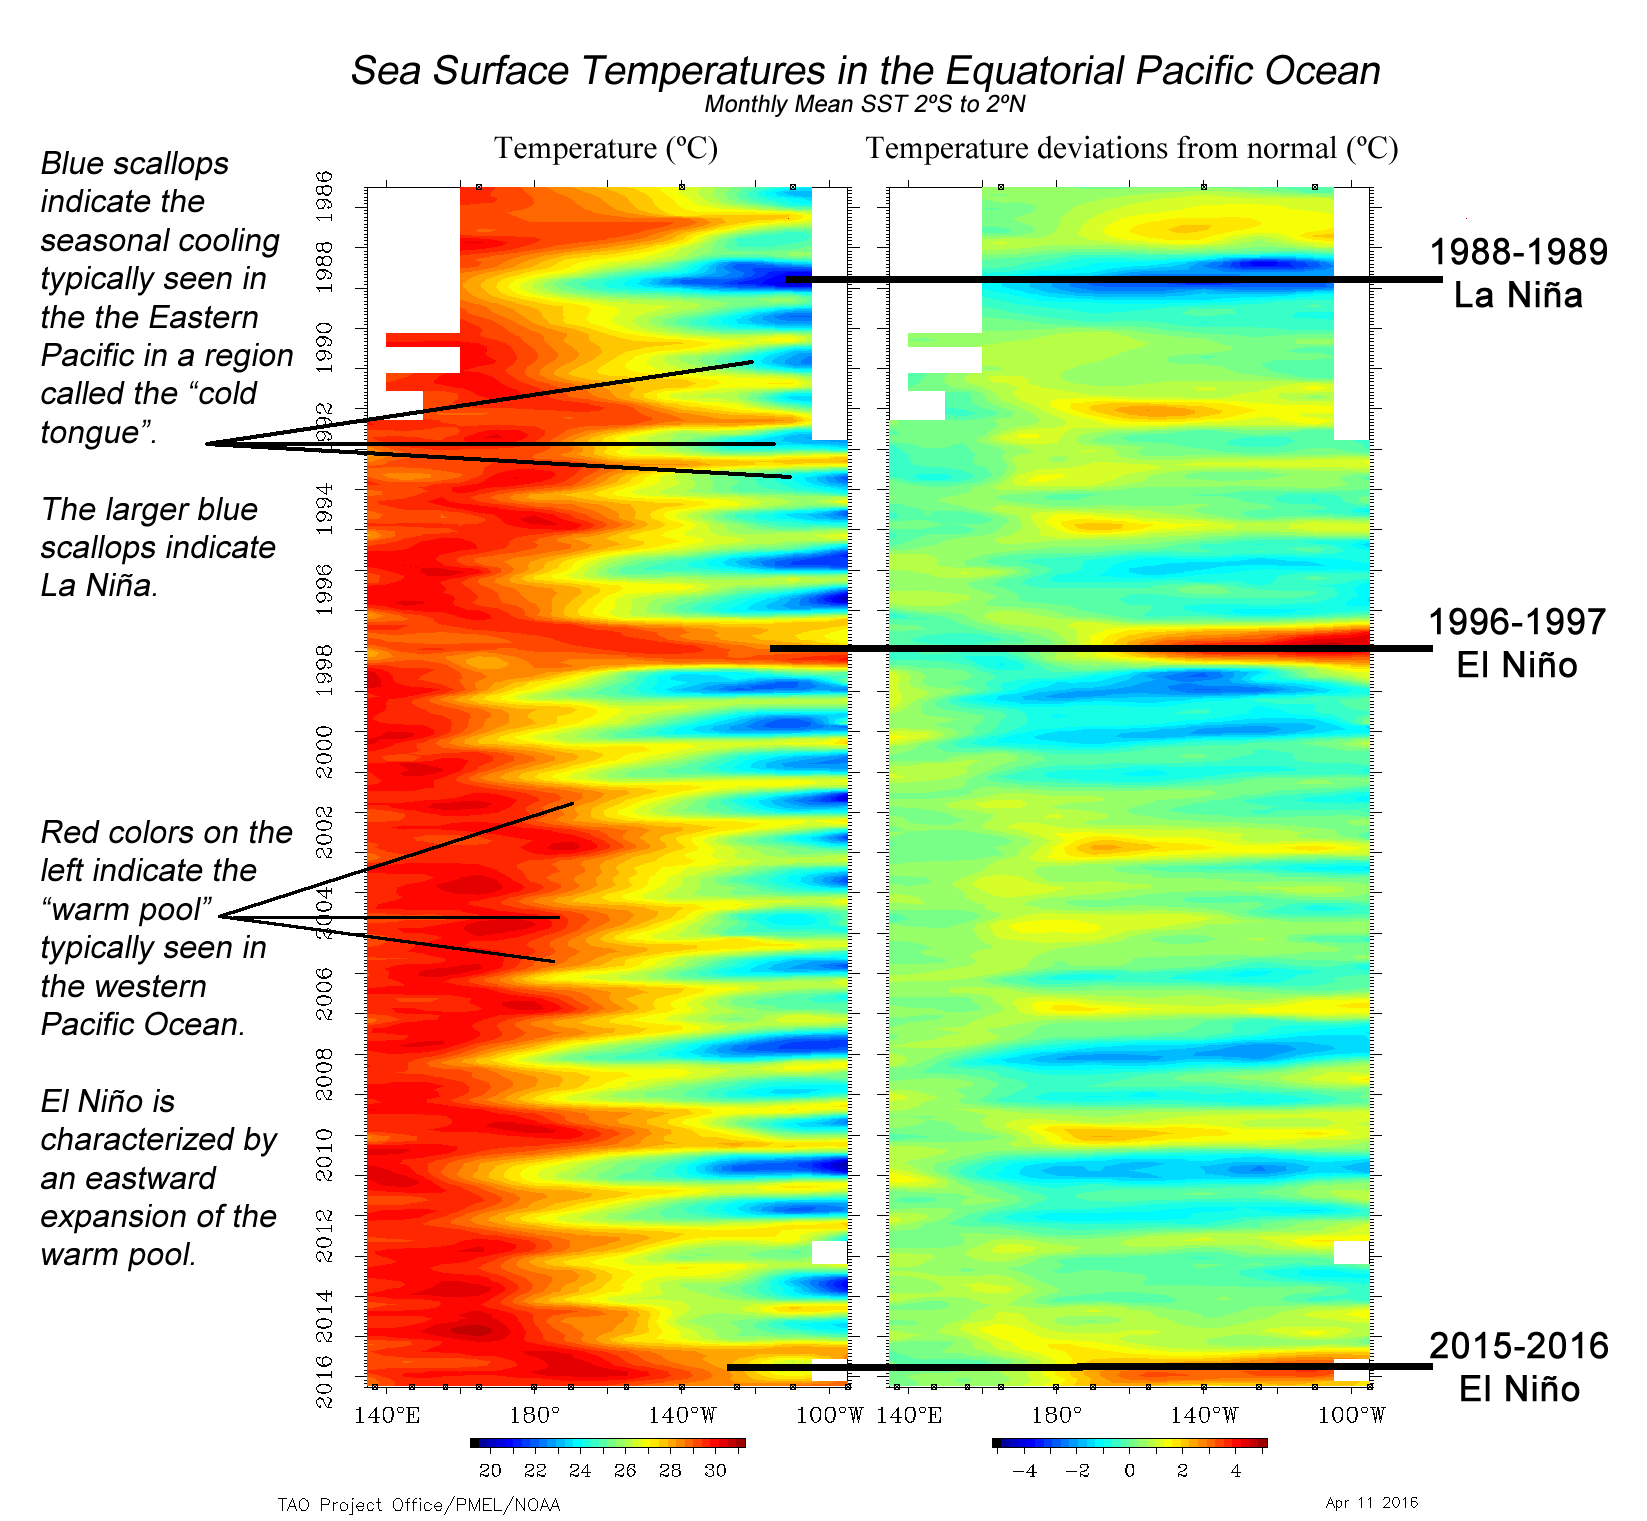
The Pacific Ocean goes back and forth between El Nino and La Nina. That back-and-forth action is called ENSO by scientists. It stands for El Nino Southern Oscillation. Sometimes we are in an El Nino (more warmer water) and other times we are in a La Nina (more cooler water).
The reason one develops instead of the other is – quite – complicated so hang on tight, we are about to get nerdy…
ENSO is the result of the interaction between the surface layers of the ocean and the immediate atmosphere above it in the tropical Pacific. The internal dynamics of that relationship (the coupled ocean-atmosphere system) involving unstable air-sea interaction and planetary-scale oceanic waves determines which one, El Nino or La Nina, happen. Because the interaction is locally based, but results in global changes, forecasting the development or termination of either El Nino or La Nina is both very difficult and important.
The reason ENSO changes what the atmosphere does, and not the other way around is because this change in water temperature is not seasonally dependent. It isn’t like lake or river temperatures where it is cooler in the winter and warmer in the summer.
What does this mean for the weather during the Winter?
Generally a LA Nina promotes the development of severe weather across the MS/AL/LA region. And southeast. We are generally warmer in the winter. And generally drier.
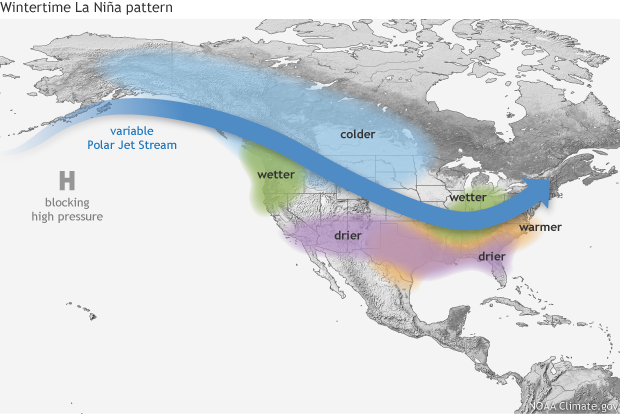
According to research by Mark Bove, a researcher at Florida Sate University, “The Ohio River Valley and Deep South see a region of statistically significant increased tornadic activity during La Niña.”

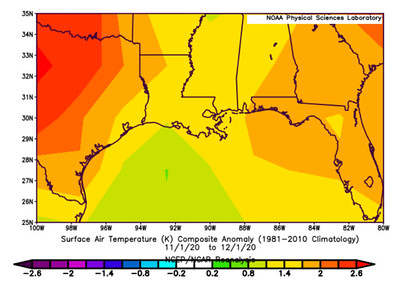
The graphic above shows the difference between an . ENSO-neutral year (normal) and a LA Nina year (colder water). It is broken down by three-month intervals: (a) January-February-March, (b) February-March-April, (c) March-April-May, (d) April-May-June.
Notice the red blocks near us for (a), (b) but then those areas lift to our north by (c) and (d). So, despite the “generally drier than normal’ tendencies with La Nina, statistically, there is a section of the severe season that gives the Pine Belt more chances for storms, and thus, tornadoes.
That is between January and April.
Evidence for that is also supported by the historical precipitation data collected during La Nina years.

It sounds worse than it probably is
Well, keep in mind that, just like hurricanes and tornadoes, every La Nina is different. Not every one is full of doom and gloom. And with a La Nina Watch issued, it doesn’t guarantee a La Nina will develop.
And just because last winter was a La Nina, too, doesn’t mean this year will be just like last year. Or any other recent La Nina Winter. And even if La Nina means ‘generally warmer and drier’ that doesn’t mean the forecast will be. Nor does it mean it can’t get cold.
The rare snowfall of December 2017 happened during a La Nina.
So, again, it isn’t all doom and gloom.
So what is the outlook, then Nick?
This is Part One! Part Two will be out soon with a look at the actual Outlook. But this was the first piece of the puzzle. And since I have the first piece, I wanted ot share it with everyone.
But the actual outlook will be out at a later point (I’m hoping within a week or two). I’m also hoping it will be a bit more accurate than last Winter’s outlook.
Last Winter Outlook….
November
Normal Averages
Low Temp – around 45
High Temp – around 70
Precip – around 4.25″
Outlook
Temperature: Slightly Warmer
Precipitation: Slightly Drier
February
Normal Averages
Low Temp – around 40
High Temp – around 65
Precip – around 5.5″
Outlook
Temperature: Slightly Warmer
Precipitation: Much Drier
December
Normal Averages
Low Temp – around 40
High Temp – around 65
Precip – around 5.00″
Outlook
Temperature: Warmer
Precipitation: Slightly Wetter
March
Normal Averages
Low Temp – around 45
High Temp – around 75
Precip – around 5.5″
Outlook
Temperature: Cooler
Precipitation: Average
January
Normal Averages
Low Temp – around 35
High Temp – around 60
Precip – around 5.5″
Outlook
Temperature: Much Warmer
Precipitation: Wetter
Last Winter temperatures looked like this…


And for precipitation:


I got November on the nose and then… Well, in short, my forecast could be summed up as:

I know many folks might say, ‘Well, I’ll just stick to my Farmer’s Almanac,’ but they didn’t do well, either. And they aren’t even trying to be specific.
Here is the Farmer’s Almanac from last year:
It was the 35th coldest winter on record in Mississippi, the 19th coldest in Alabama, and the 43rd coldest in Louisiana. Precipitation-wise things were about average.
But I’ve learned a lot in my new job and this past Summer the outlook was much better. It said:

We got:


It was the wettest summer on record for Mississippi, the second-wettest for Alabama and the 17th-wettest for Louisiana. I think that counts for “above average.” Temperatures hovered prety close to average, with all three states within 15 years of “average.”
So I’m putting all of my new skills to the test this winter and the full outlook will be out soon!


2 thoughts on “2021-2022 Winter Preview Pt.1 – La Nina & analogs”
Comments are closed.