As always, a reminder that I am not a doctor, nor am I a medical profesional. I do mathematics and statistics for a living.
These posts are an attempt to give a plain-English update to the COVID-19 outbreak, grab the research behind some of the headlines, and present it all in an easy to digest way.
Again, I am not a medical researcher. I am simply highlighting those who are.
Latest Numbers
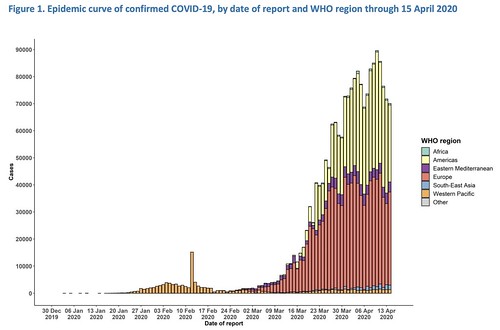
WHO Numbers
Total Worldwide Cases: 1,914,916
Total Worldwide Deaths: 123,010
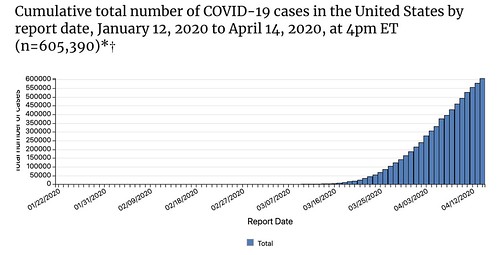
CDC Numbers
Total United States cases: 605,390
— Travel-related: 6,814
— Close contact: 14,728
— Under investigation: 583,848
Total deaths: 24,582
States reporting cases: 50 states, District of Columbia, Puerto Rico, Guam, the Northern Mariana Islands, and the U.S. Virgin Islands
COVID-19 cases reported by other medical sites:
Johns Hopkins
Total Worldwide Cases: 2,081,969
Total Worldwide Deaths: 138,487
Total Worldwide Recovered: 525,884
Total US cases: 639,733
Total US deaths: 30,990
Total US recovered: 52,739
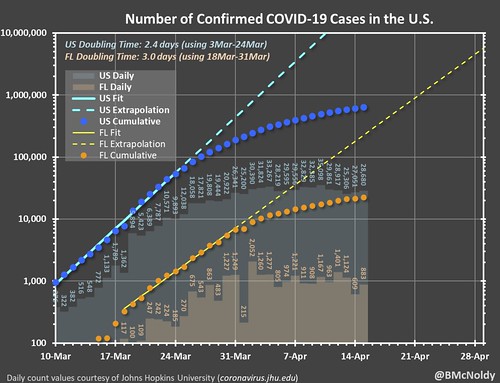
Brian McNoldy, Senior Research Associate at Univ. of Miami’s Rosenstiel School, put a chart together of the growth. As it notes, it is pulling numbers from the Johns Hopkins totals.
Regional Numbers
| Cases | Tested | Deaths | %-positive | Mortality Rate | |
| MS | 3360 | 37733 | 122 | 8.90% | 3.63% |
| LA | 21951 | 116111 | 1103 | 18.91% | 5.02% |
| AL | 4249 | 36363 | 126 | 11.68% | 2.97% |
| TN | 6079 | 80896 | 135 | 7.51% | 2.22% |
| AR | 1599 | 22289 | 34 | 7.17% | 2.13% |
| Total | 37238 | 293392 | 1520 | 12.69% | 4.08% |
Hospitalizations
| Hopitalized | Ventilators | Percent Hospitalized | |
| MS | 635 | 18.90% | |
| LA | 1943 | 425 | 8.85% |
| AL | 553 | 13.01% | |
| TN | 663 | 10.91% | |
| AR | N/A | N/A | |
| Total | 3794 | 12.92% |
Making Estimates from past research
I talked about research from the Cruise Ships that may be relevant to estimating the number of cases without testing everyone (since that isn’t a feasible option). Plus, this type of estimate would make a good “first guess” at the number of asymptomatic people (the people who don’t feel sick, but are still infected), too.
This type of estimating isn’t perfect. In fact, it is far from it. And it is just an estimate. But based on the past research, it is at least a start.
| Estimated Symptomatic | Estimated Asymptomatic | Estimated total | |
| MS | 5125 | 1125 | 6250 |
| LA | 33480 | 7349 | 40829 |
| AL | 6481 | 1423 | 7903 |
| TN | 9272 | 2035 | 11307 |
| AR | 2439 | 535 | 2974 |
| Total | 56795 | 12467 | 69263 |
Numbers add evidence showing it was never “just the flu”
Doctors and the medical field were very concerned about COVID-19 due to the speed of transmission and the depths of potential sickness. When I started posting about this back in February, I tried to include a portion of each post explaining, according to doctors and medical professionals, how this virus was different than the regular flu.
Now, we finally have numbers to show.
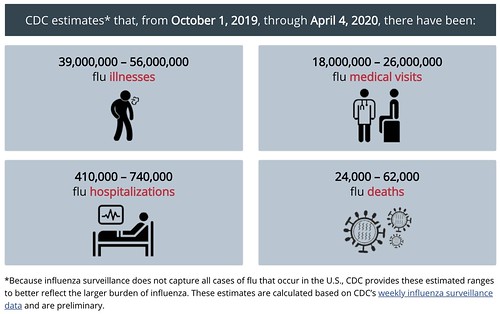
From the CDC:
The estimates of the cumulative burden of seasonal influenza are subject to several limitations.
First, the cumulative rate of laboratory-confirmed influenza-associated hospitalizations reported during the season may be an under-estimate of the rate at the end of the season because of identification and reporting delays.
Second, rates of laboratory-confirmed influenza-associated hospitalizations were adjusted for the frequency of influenza testing and the sensitivity of influenza diagnostic assays. However, data on testing practices during the 2019-2020 season are not available in real-time. CDC used data on testing practices from the past influenza seasons as a proxy. Burden estimates will be updated at a later date when data on contemporary testing practices become available.
Third, estimates of influenza-associated illness and medical visits are based on data from prior seasons, which may not be accurate if the seriousness of illness or patterns of care-seeking have changed.
Boy, have we ever learned a lot about estimations and assumptions! While those numbers are not finalized nor complete, and there are limitations to the accuracy, they are worth enough to make some comparisons. It isn’t perfect, on many levels, but let’s give it a shot and see what we find.
In 76 days since the first official case, COVID-19 has infected – at least – 600,000 people. Almost 3,000,000 have been tested. It has sent about 90,000 to the hospital. It has killed at least 24,000 people.
Since 76 days is 41-percent of the above-designated flu season, comparing the numbers across should be pretty straight-forward. If COVID-19 were “just like the flu” just run the flu numbers at 41-percent of total and make the comparison.
| Flu cases | COVID-19 cases | Percentage of | |
| Cases | 19,475,000 | 600,000 | 3.08% |
| Doc visits / tests | 9,020,000 | 3,000,000 | 33.26% |
| Hospitalizations | 235,750 | 90,000 | 38.18% |
| Deaths | 17,630 | 24,000 | 136.13% |
So, in the same amount of time that COVID-19 has been around, the regular old flu would’ve infected far more people, sent more people to the doctor, and hospitalized more more people, too.
But COVID-19 would’ve killed more people.
Some may say, “See! Coronavirus isn’t that bad. More people get sick from the flu!”
And at face-value, that makes sense. But the face-value of the data here misses a big point. Well a few points, really. But the big one is, well, the big one.
The flu season was allowed to run its course with no intervention.
Since the flu (like COVID-19) spreads based on transmission of one person-to-the-next, the totals numbers don’t grow linearly, meaning the total at the end divided-back to an earlier point won’t tell the whole story. And on the flip-side, the “COVID-19 Season” was just starting, before massive efforts to curb it were put in place. Since it, too, spreads through transmission of one person-to-the-next, all of the social distancing measures have really put a lid on how high the numbers could get in comparison (which, while tougher on the math side, is good on the human side).
The troubling thing is that even with intervention, COVID-19 has still killed more people in 76 days than the Flu would have in the same amount of time.
So, Nick, what does this really tell us, then?
I would say, mathematically-speaking, it only tells us that COVID-19 is statistically more deadly than the flu. And that “slowing the spread” and “flattening the curve” were solid investments given the mathematical trajectory of COVID-19.
Could your shoes infect your house
Maybe. I saw a headline today that read, something to the effect of… “Take off your shoes, experts say floors test positive for COVID-19”
Let’s do some scientific unpacking.
In a new paper, titled, “Aerosol and Surface Distribution of Severe Acute Respiratory Syndrome Coronavirus 2 in Hospital Wards, Wuhan, China, 2020” researchers went through a hospital and ICU to try to figure out where they could find the virus and what surfaces were most likely to have the virus.
In the abstract, the authors wrote: “Contamination was greater in intensive care units than general wards. Virus was widely distributed on floors, computer mice, trash cans, and sickbed handrails and was detected in air ≈4-meters from patients.”
From the paper:
Almost all positive results were concentrated in the contaminated areas (ICU 54/57, 94.7%; GW 9/9, 100%); the rate of positivity was much higher for the ICU (54/124, 43.5%) than for the GW (9/114, 7.9%) (Tables 1, 2). The rate of positivity was relatively high for floor swab samples (ICU 7/10, 70%; GW 2/13, 15.4%), perhaps because of gravity and air flow causing most virus droplets to float to the ground. In addition, as medical staff walk around the ward, the virus can be tracked all over the floor, as indicated by the 100% rate of positivity from the floor in the pharmacy, where there were no patients. Furthermore, half of the samples from the soles of the ICU medical staff shoes tested positive. Therefore, the soles of medical staff shoes might function as carriers. The 3 weak positive results from the floor of dressing room 4 might also arise from these carriers. We highly recommend that persons disinfect shoe soles before walking out of wards containing COVID-19 patients.
The big thing here is that the Pharmacy, where no patients had been, did have positive test results on the floor. A good indicator that the virus, once on a shoe, can be carried to another room in a building.
The authors noted that there were limitations. The wrote: “First, the results of the nucleic acid test do not indicate the amount of viable virus. Second, for the unknown minimal infectious dose, the aerosol transmission distance cannot be strictly determined.”
I would argue that there is a big difference between carrying a virus on your shoe when walking around a hospital and walking around the store, walking back to your car, driving home, and then walking into your house. In not only mileage but also in surface composition. Cold tile versus hot asphalt, for one.
That doesn’t mean you can’t carry the virus with you on your shoe. What it does mean is that there is – likely – still too much variability within the potential data to jump to any conclusions. Hopefully more studies will come out to corroborate these findings with different tests (grocery store floors, department store floors, etc).
The bottom line, take off your shoes to be better safe than sorry. Or perhaps go scuff around in the grass for a while? But this new study was pretty specific about where the virus was found and where the study took place. In a hospital. Not your neighborhood.
Social distancing through 2021
You probably saw this as a headline somewhere recently. It seems to stem from this paper, “Projecting the transmission dynamics of SARS-CoV-2 through the postpandemic period”
I’ll be honest. This is one of those papers that I am having trouble wrapping my brain around. It is very dense. I’ll continue to read up on this and try to get a better idea about what it all means.
For now, I’ll try to give an explanation as to why you’re seeing those headlines.
The paper highlights a handful of different scenarios given the available data the medical field has learned about COVID-19. In one of the scenarios (I don’t know if it is the “worst-case scenario” or not) it showcased that social distancing may need to remain in place through 2021 and the illnes would fade into 2022.
But I’m still trying to wrap my head around all of it.
COVID-19 came from a lab
This has a lot of sticky political implications. But I did want to take a quick second to point out that I did read that there was a team of researchers working on bats (just like teams of researchers do all over the world) and bat viruses in China. They were doing their research in a lab. If a virus from a bat mutated to infect humans, and did so in that lab, and then someone left that lab, it is still bad.
But the headlines that read, “COVID-19 started in a lab” carry an – at this point – unknowable and somewhat accusatory tone. Like someone was “making” this virus. When in fact, it could simply be a case of accidental exposure.
But we don’t know. And, with science, it is very important not to jump to conclusions before enough evidence is examined. In headline writing, well, you guys know how that goes.
Blood clots may play a role in severity
While this study used a small sample size, it does provide some interesting result. A new study from the Icahn School of Medicine at Mount Sinai provides evidence that blood clots in the lungs may play a role in the more severe cases of COVID-19. Mount Sinai writes, “The finding suggests that treatment for respiratory failure caused by COVID-19 might follow the model for stroke—anticoagulation drugs for milder cases and thrombolysis, or clot removal, with continued anticoagulation for more severe disease.”
SARS-CoV-2, the virus that causes COVID-19, is closely related to SARS-CoV-1, the virus that caused the SARS outbreak in 2003. Previous autopsy studies from SARS cases demonstrated pulmonary thrombi, pulmonary infarcts, and microthrombi in other organs. Pulmonary thrombi are blood clots in the lungs that can cause pulmonary infarcts, the death of lung tissue due to lack of blood supply. Now, studies show that SARS-CoV-2 appears to be causing similar pathophysiological derangements. Although microthrombi, clots in small blood vessels, are present in sepsis and classic forms of ARDS, they are not the principal drivers of respiratory failure and organ dysfunction in those cases. In COVID-19 pneumonia, the thrombi may play a direct and significant role in gas exchange abnormalities and in multisystem organ dysfunction, the Mount Sinai researchers said.
The researchers observed five cases of COVID-19 patients at Mount Sinai Health System hospitals with refractory respiratory failure requiring mechanical ventilation and shock. Significant pulmonary microthrombi and/or macrothromboses were suspected to be serving as drivers of this pre-terminal state. The patients were administered tPA, a thrombolyic agent used to dissolve blood clots. All cases showed rapid improvement in alveolar ventilation, oxygenation, and/or shock.
As with many of the initial findings with COVID-19, more research and study will be needed.
Masks recommended by the CDC, new research backs up recommendation
New research in the New England Journal of Medicine shows that droplets capable of carrying the virus are released when simply talking. The ‘correspondence’ titled, “Visualizing Speech-Generated Oral Fluid Droplets with Laser Light Scattering” used a laser light-scattering experiment in which speech-generated droplets and their trajectories were visualized.
From the authors:
The output from a 532-nm green laser operating at 2.5-W optical power was transformed into a light sheet that was approximately 1 mm thick and 150 mm tall. We directed this light sheet through slits on the sides of a cardboard box measuring 53×46×62 cm. The interior of the box was painted black. The enclosure was positioned under a high-efficiency particulate air (HEPA) filter to eliminate dust.
When a person spoke through the open end of the box, droplets generated during speech traversed approximately 50 to 75 mm before they encountered the light sheet. An iPhone 11 Pro video camera aimed at the light sheet through a hole (7 cm in diameter) on the opposite side of the box recorded sound and video of the light-scattering events at a rate of 60 frames per second. The size of the droplets was estimated from ultrahigh-resolution recordings. Video clips of the events while the person was speaking, with and without a face mask, are available with the full text of this letter at NEJM.org.
The researchers found that when people said a casual reminder to, “stay healthy” numerous droplets ranging from 20 to 500 μm were generated. The volume of speaking did have an influence on the number of droplets created.
According to the CDC:
Cloth face coverings should…
— fit snugly but comfortably against the side of the face
— be secured with ties or ear loops
— include multiple layers of fabric
— allow for breathing without restriction
— be able to be laundered and machine dried without damage or change to shape
CDC recommends wearing cloth face coverings in public settings where other social distancing measures are difficult to maintain (e.g., grocery stores and pharmacies), especially in areas of significant community-based transmission.
CDC also advises the use of simple cloth face coverings to slow the spread of the virus and help people who may have the virus and do not know it from transmitting it to others. Cloth face coverings fashioned from household items or made at home from common materials at low cost can be used as an additional, voluntary public health measure.
Cloth face coverings should not be placed on young children under age 2, anyone who has trouble breathing, or is unconscious, incapacitated or otherwise unable to remove the mask without assistance.
The cloth face coverings recommended are not surgical masks or N-95 respirators. Those are critical supplies that must continue to be reserved for healthcare workers and other medical first responders, as recommended by current CDC guidance.
The CDC says that you should be careful not to touch your eyes, nose, or mouth when removing the mask. And wash your hands immediately after removing.
The CDC has a few quick tips on making your own mask. One way, with no sewing needed, is by cutting an old Tshirt.

There is more information and a tutorial on how to make your own mask here: https://www.cdc.gov/coronavirus/2019-ncov/prevent-getting-sick/diy-cloth-face-coverings.html


