Good news and bad news, friends. The good news is that the line of storms will be waiting just a bit longer to arrive. So you’ll have some extra time to prepare for the wall or water and wind that will blow through as the line passes.
The bad news is that there is an increasing potential for storms to form ahead of the line. These storms would have a higher tornado risk as well as a higher risk for a stronger tornado. Not a guarantee, but the numbers are also not friendly.
Looking at the Karrie Meter Tester map, it shows a rather wide spread of potential 4s across the region. This Tester run is a “plus 10-percent” run where I take the atmosphere as add 10-percent to the parameters to test how things may look if things shake out more potent than model guidance would suggest.
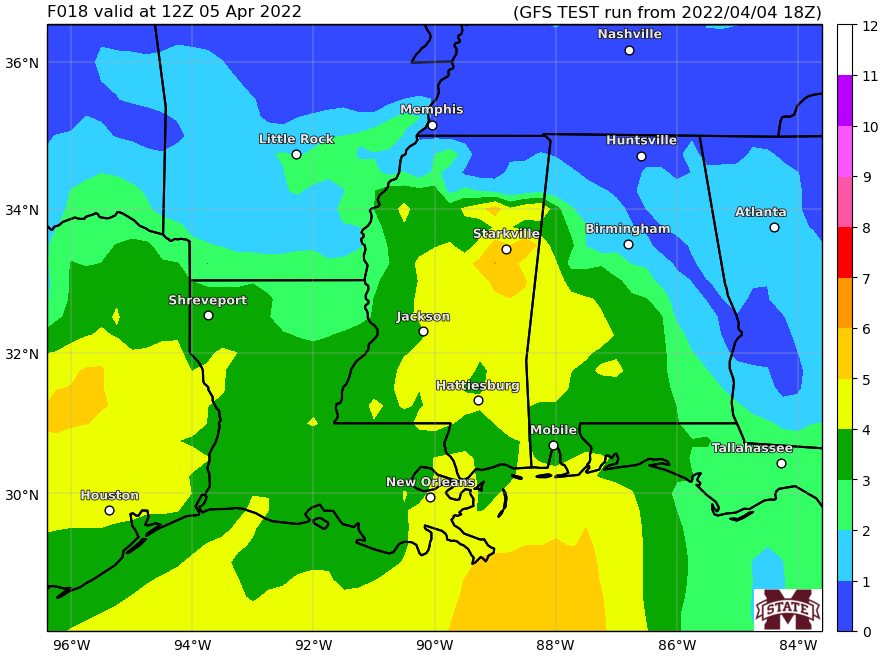
You could almost think of the map above as a reasonable ‘how bad can it get’ if things shake out differently look at things. And in this case, I tend to think it is a bit more representative of the eventual atmosphere.
Model data
Looking at the 00z HRRR model, it shows a handful of storms ahead of the main line trying to develop. It isn’t as robust this evening as it was feeling this afternoon (thankfully), but it still shows the potential for some potent storms ahead of the line of storms.


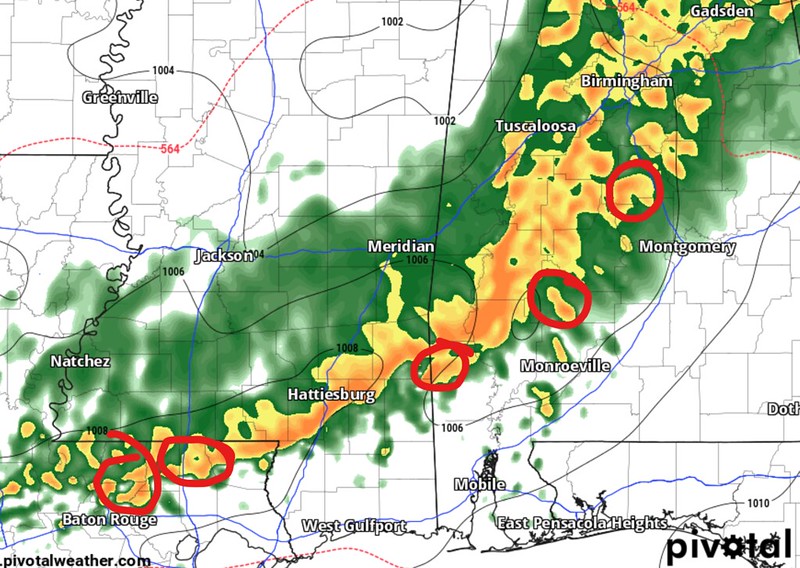
The red circled areas are potential supercells ahead of the main line. Notice that by 10a many of them get ingested by the squall line and become embedded. Still not great, but that may help to limit the potential severe threat a bit by that point. Though, given the axis / lean relative to the low-level and mid-level flow, I’d argue that even the embedded supercells will still be capable of producing all modes of severe weather.
The Updraft Helicity Streaks show a handful of spots with yellows and reds, which is disconcerting. Not alarming, but does make me stop for a second and double-check some math.
A quick reminder. This is very important! These streaks are a good product to gain a better understanding of the potential environment, but not for placement. So if you see a streak across your county… that doesn’t mean it will definitely happen. Instead, use these as a good barometer (pun intended) of how many storms the computer thinks will feature a stronger rotation relative to others.
In this case, it seems like a about a quarter of the storms will be rotating with some decent torque.

Often when we start to see yellows and reds, it is an indication that the computes are picking up on the potential for tornadoes to develop – given that storms are surface-based and we can actually pull a tornado out of the clouds.
But again, placement is not where these model do a great job. They do better with ‘reading the room’ so to speak to see what it possible, not where it will happen.
The Bottom Line
With all of that being said, here are the changes….
WHO SEES WHAT DURING THE STORMS?
EVERYONE — Brief heavy rain, lightning, wind gusts up to 35mph
MOST AREAS — Brief heavy rain, lightning, wind gusts up to 45mph
MANY PLACES — A few rounds of heavy rain, ponding in low-lying areas, a lot of lightning, wind gusts up to 55mph
SOME PEOPLE — One extended round of Heavy rain, brief localized flash flooding, frequent lightning, wind gusts up to 60mph, small hail
FEW SPOTS — Very heavy rain, localized flash flooding, frequent lightning, wind gusts up to 65mph, hail up to the size of quarters, a tornado (up to EF-3 in strength)
So everyone has the potential for severe weather. Most people, though, won’t see a severe storm. A strong storm? Sure. Wind capable to knocking down a tree? Absolutely. But the chance you see a severe storms tomorrow is higher than normal, but not a guarantee.
Here is a look at some of the areas that appear to have the highest risk based on a blend of the Karrie Meter and the Updraft Helicity Streaks.

Outside of those red circles, are you in the clear. Absolutely NOT. That is simply an estimation about the worst of the worst. If those areas see an EF-3 tornado, but a place outside of those areas gets an EF-2 tornado, the circles are still accurate. Because they aren’t there for absolutes, but rather for comparisons.
What they are there to do is help folks in those circles be just a little more vigilant tomorrow about watching the weather, keeping up with watches and warnings from the NWS, and having a plan if severe weather strikes.
So what are the potentials? How have those changed? Here is a look:
SEVERE WEATHER RISK POTENTIAL
** Between 5a and 11a Tuesday morning **
HEAVY RAIN
BRIEF, LOCALIZED FLASH FLOODING
FREQUENT LIGHTNING
WIND GUSTS UP TO 65MPH
HAIL UP TO THE SIZE OF QUARTERS
A FEW TORNADOES (Up to EF-3 in strength)


