The latest statistics
WHO Numbers
Total Worldwide Cases: 822,914
Total Worldwide Deaths: 40,598

This chart from the WHO showed a plateau in numbers. The last few times this has happened, it didn’t stick. This time it did not, either.
CDC Numbers
Total United States cases: 186,101
— Travel-related: 1,110
— Close contact: 3,128
— Under investigation: 181,863
Total deaths: 3,603
States reporting cases: 50 states, District of Columbia, Puerto Rico, Guam, and US Virgin Islands
COVID-19 cases reported by other medical sites:
Johns Hopkins
Total Worldwide Cases: 937,091
Total Worldwide Deaths: 47,208
Total Worldwide Recovered: 193,764
Total US cases: 215,417
Total US deaths: 5,116
Total US recovered: 8,566
From Johns Hopkins: “Based on available modeling, notably by the Institute for Health Metrics and Evaluation , the US government projects at least 100,000 deaths nationwide, under continued and effective implementation of social distancing measures.”
Brian McNoldy, Senior Research Associate at Univ. of Miami’s Rosenstiel School, put a chart together of the growth. As it notes, it is pulling numbers from the Johns Hopkins totals. It shows the double-time of cases as about two-and-a-half days.
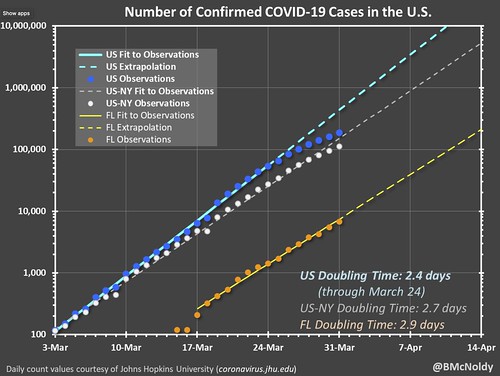
This is a good-looking trend. Notice that the dots are starting to fall short of the extrapolated trendline. That is a good indicator that Social Distancing is starting to slow the spread – a little.
One thing to note, is the mortality rate has increased across all states from last week. Sadly, as this virus continues to infect new people, some of the people who were sick last week are beginning to succumb to the illness.
Regional Numbers
| Cases | Tested | Deaths | Percent-positive | Mortality Rate | |
| MS | 1073 | N/A | 22 | N/A | 2.05% |
| LA | 6424 | 42078 | 273 | 15.27% | 4.25% |
| AL | 1106 | 7774 | 28 | 14.23% | 2.53% |
| TN | 2683 | 30496 | 24 | 8.80% | 0.89% |
| AR | 624 | 8460 | 10 | 7.38% | 1.60% |
| Total | 11910 | 88808 | 357 | 13.41% | 3.00% |
A few states in the region do release the number of hospitalized people due to COVID-19. Those numbers are as follows:
Mississippi: 218
Louisiana: 1,498 (490 on ventilators)
Alabama: Not given
Tennessee: 200
Arkansas: Not given
Making Estimates from past research
I talked about research from the Cruise Ships that may be relevant to estimating the number of cases without testing everyone (since that isn’t a feasible option). Plus, this type of estimate would make a good “first guess” at the number of asymptomatic people (the people who don’t feel sick, but are still infected), too.
This type of estimating isn’t perfect. In fact, it is far from it. And it is just an estimate. But based on the past research, it is at least a start.
| Estimated Symptomatic | Estimated Asymptomatic | Estimated total | |
| MS | 1637 | 359 | 1996 |
| LA | 9798 | 2151 | 11949 |
| AL | 1687 | 370 | 2057 |
| TN | 4092 | 898 | 4990 |
| AR | 952 | 209 | 1161 |
| Total | 18165 | 3987 | 22153 |
What does the term “mild symptoms” mean?
This one surprised me. The term “Mild symptoms” was described to me by a doctor as “symptoms that do not require hospitalization.”
Originally, I though “mild” meant “not so bad.” You know, mild? Like a cough and a runny nose, right?
Wrong.
It means, as this Doctor put it, “you will not require hospitalization.” And that puts a whole-nother lens on what it means to get sick from COVID-19. Because I’ve been dog sick before and never went to the hospital. And that explains the stories I’ve heard from friends who have been sick from COVID-19. They felt like a ton of bricks hit them, they could barely breathe at times, and got tired just walking to the bathroom. But it wasn’t bad enough to be hospitalized, so that was “mild.”
It also reminds me of how I know that an “Enhanced Risk” for severe weather from the SPC is lower than a “Moderate Risk” for severe weather, while some people may look at it in the opposite way.
New from the CDC
The CDC published a report from Wycliffe E. Wei, MPH1; Zongbin Li, MBBS1; Calvin J. Chiew, MPH1; Sarah E. Yong, MMed; Matthias P. Toh, MMed,; Vernon J. Lee, PhD1, titled, “Presymptomatic Transmission of SARS-CoV-2 — Singapore, January 23–March 16, 2020” that looks at how people are passing the virus to others before they even know they have it.
The authors provided a handful of examples of actual traces. These are not hypotheticals, but rather, real things that actually happened:
Cluster A. A woman aged 55 years (patient A1) and a man aged 56 years (patient A2) were tourists from Wuhan, China, who arrived in Singapore on January 19. They visited a local church the same day and had symptom onset on January 22 (patient A1) and January 24 (patient A2). Three other persons, a man aged 53 years (patient A3), a woman aged 39 years (patient A4), and a woman aged 52 years (patient A5) attended the same church that day and subsequently developed symptoms on January 23, January 30, and February 3, respectively. Patient A5 occupied the same seat in the church that patients A1 and A2 had occupied earlier that day (captured by closed-circuit camera) (5). Investigations of other attendees did not reveal any other symptomatic persons who attended the church that day.
Cluster B. A woman aged 54 years (patient B1) attended a dinner event on February 15 where she was exposed to a patient with confirmed COVID-19. On February 24, patient B1 and a woman aged 63 years (patient B2) attended the same singing class. Two days later (February 26), patient B1 developed symptoms; patient B2 developed symptoms on February 29.
Cluster C. A woman aged 53 years (patient C1) was exposed to a patient with confirmed COVID-19 on February 26 and likely passed the infection to her husband, aged 59 years (patient C2) during her presymptomatic period; both patients developed symptoms on March 5.
Cluster D. A man aged 37 years (patient D1) traveled to the Philippines during February 23–March 2, where he was in contact with a patient with pneumonia who later died. Patient D1 likely transmitted the infection to his wife (patient D2), aged 35 years, during his presymptomatic period. Both patients developed symptoms on March 8.
Cluster E. A man aged 32 years (patient E1) traveled to Japan during February 29–March 8, where he was likely infected, and subsequently transmitted the infection to his housemate, a woman aged 27 years (patient E2), before he developed symptoms. Both developed symptoms on March 11.
Cluster F. A woman aged 58 years (patient F1) attended a singing class on February 27, where she was exposed to a patient with confirmed COVID-19. She attended a church service on March 1, where she likely infected a woman aged 26 years (patient F2) and a man aged 29 years (patient F3), both of whom sat one row behind her. Patient F1 developed symptoms on March 3, and patients F2 and F3 developed symptoms on March 3 and March 5, respectively.
Cluster G. A man aged 63 years (patient G1) traveled to Indonesia during March 3–7. He met a woman aged 36 years (patient G2) on March 8 and likely transmitted SARS-CoV-2 to her; he developed symptoms on March 9, and patient G2 developed symptoms on March 12.
The one in there that really surprised me was patient C1 who was exposed to COVID-19 on February 26th and did not show symptoms for nine days. All the while, she was capable of infecting others.
To put that into perspective, holding the door open for someone on a Friday night. You then had an itch on your eye and scratched it without thinking. And said, “Oh no! I’ve been infected!” Then waiting until Wednesday (five days), only to say, “oh man, I’m safe! No sickness for me!” only to wake up on Sunday (nin days later) with a cough and a fever. Holy moly.
IHME modeling for COVID-19 in Mississippi
IHME is the Institute for Health Metrics and Evaluation. It is run from the University of Washington and was stated back in 2007. For COVID-19 the team of researchers has been producing graphs, charts and projections for each state as well as the entire country.

Here is a look at the chart from https://covid19.healthdata.org/. This site is attempting to track COVID-19 and make projections for the total illnesses and the potential response needed by each state.
The above chart is for Mississippi.
The projections indicate that there is a high probability that not all hospital beds will be filled with COVID-19 patients. However, there is a possibility that the state will need between 275 and 919 ICU beds. And, at the time of this research, there are only 320 ICU beds available. And there may be the need of 220 to 733 ventilators.
The model also projects between 440 and 1,595 deaths. In just Mississippi.
Things you should be doing now
I know this can all seem overwhelming at times. The sheer amount of information being kicked out by every media outlets is like an avalanche.
So, here are some things: Stay home if you can! Gotta work? That’s understandable. Need food? Sure, head to the store. But try to skip any “for fun” activities in public where you would be interacting with others or in a place with multiple other people.
Some CDC’s guidance:
— Know where to get your local / state-level information
For Mississippi: https://msdh.ms.gov/msdhsite/_static/14,0,420.html
For Louisiana: http://ldh.la.gov/Coronavirus/
For Alabama: http://www.alabamapublichealth.gov/infectiousdiseases/2019-coronavirus.html
If you live in a state outside of the region, head to google and type in, “dept of health” followed by whatever state you live. Google should take you to that state’s department of health and on the main page, most states have a link to an update on the Coronavirus.
— Know the Symptoms
Look for things like a fever, dry cough, and shortness of breath. But also know when it may become an emergency. It becomes an emergency when you have difficulty breathing, a persistent pain or pressure in the chest, you develop general confusion, and if you develop bluish lips or face. Also recognize that body aches, weak stomach, nasal congestion, a sore throat, and other symptoms of the regular flu are not the same as the symptoms with Coronavirus.
— Stay home when you are sick
Any kind of sick. If you feel like you may have Coronavirus, call your health care provider’s office in advance of a visit. If you have any sickness, the CDC recommends to limit movement in the community, limit visitors, and practice good social distancing.
— Know if you are at a higher risk
Know what additional measures those at higher risk and who are vulnerable should take. Those at higher risk include older adults (over 60), people who have serious chronic medical conditions (like heart disease, diabetes, lung disease). Some research has indicated that people with asthma may also be included in the higher risk category.
— Take steps to mitigate your infection
The CDC recommends to “Implement steps to prevent illness” by washing high-traffic areas more often, washing hands with soap and water and if someone is sick, to isolate the sick person into a low-traffic area of the home.
— Create a Household Plan
Create a household plan of action in case of illness in the household or disruption of daily activities due to COVID-19 in the community.
The problem with China lying about the Coronavirus numbers
One last thing… And I went back and forth if it was even worth adding, but I’m hoping to help relax some tension with this.
I’ve received a question about China every few days. I’ve heard that “China is lying” from a handful of people. From folks I see at the store, to questions on facebook, and I’ve even heard it from government officials. And I’m not here to tell anyone they are right or wrong.
Because I don’t know. And I can’t know.
Of what I do know, there doesn’t appear to be any hard evidence that is publicly available to support such a claim. I’ve googled around but no dice. Perhaps I didn’t goolge hard enough, though? Sure. that happens, too.
That’s not to say they couldn’t possibly be lying. All I am saying is I am not aware of any actual evidence for or against such a claim that China is lying. A lot of conjecture and presumptions. But I couldn’t find evidence. And as a scientist, I prefer evidence over conjecture.
The follow up to the question about lying is always, that could mean that the United States doesn’t actually have the most cases in the world. Sure. It could. For the moment, let’s assume that China is lying. I still think the CDC would tell us to practice Social Distancing, wash our hands and avoid those who are sick.
And since I am more interested in informing people about the science of the virus, the illness, the spread and how to protect others from becoming infected, I’m less worried about the geopolitical discussion about “who has more cases?”
You are free to debate it and talk about, I’m not going to stop you at all. But I couldn’t find any evidence so I’m not really concerned about it at this time.


