5/12/19 COVID Update: A quick update with numbers amidst re-opening
Author: Nick Lilja
|| Published: 5/12/2020 at 11:39pm
A quick personal note. I apologize for not posting more updates. After a month of twice-daily COVID updates, then a month of back-to-back-to-back-to-back severe weather my brain (and heart) needed a break from death and destruction.
But I wanted to take time to post something that I felt was being missed. Be warned, this is not a “happy” post. That isn’t to say it is “bad” news, but it isn’t “happy” news either.
As you guys all know I’m not a doctor. Nor have I ever claimed to be one. All of these updates – dating back to February – are an attempt to make all of the numbers and information flying around a bit more mentally digestible.
This post isn’t going to go too in-depth. But I have noticed that we are getting to a point where it feels like we – as a society – are getting ‘too close to the elephant’ so to speak. So I wanted to take a step back and try to showcase some of the information in a way you may not be accustomed to seeing it.
Since I’m always telling my students that “magnitude matters” and “context is key” and I want to offer some sad and sobering context about magnitude: COVID-19 has now killed, in total, almost double as many Mississippians than died from Hurricane Katrina.
New Numbers
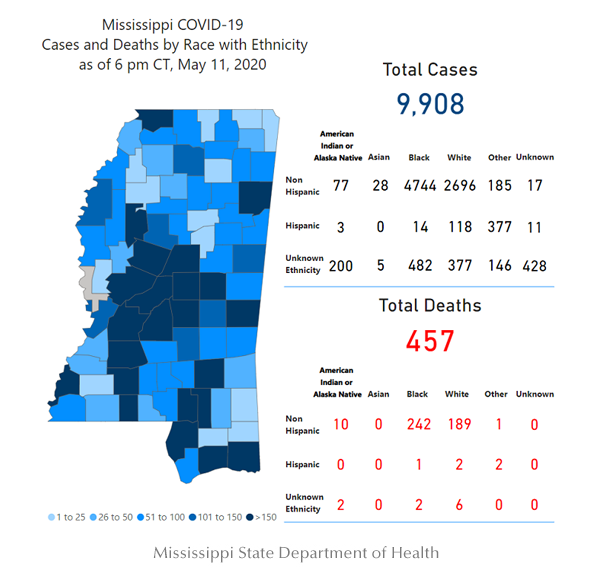
You guys are probably accustomed to seeing this graphic by now…
Courtesy: MS Dept of Health
After constantly posting the “total number” of confirmed cases for a month, a lot of people started wondering “is that a list of people with it right now, or who have ever had it in total?”
And that is a very good question to ask. You guys are smart. It is good to check things like that. And the real answer is: It is the total number of confirmed cases recorded. But we don’t know if the people who contracted it are better or not. Because that information is not tracked. That is why they offer “presumed recovered” numbers. Because they have to just assume that people are recovering if they aren’t dead.
And since the length of the illness depends on each person (I know people who have recovered in eight days while others are on Week Five of being sick) it is difficult to know for sure how many people are currently sick.
But, a lot like making the estimation about the asymptomatic people, we can attempt to make an estimation about the number of people currently sick by using past research from medical texts and the CDC.
The CDC notes that the average COVID-19 illness lasts about two weeks. So, we can look at the number of new cases by day, and project those out 14 days as a “total time of sickness” to find at what point were the most people known to be sick with COVID-19. Could more people have been sick before being tested? Sure. But because we can’t know that information, we can’t use it here.
In order to make an estimation – and in this case extrapolation – we need to start with real numbers.
Mississippi
Date
Known positive per day
Estimated Total Sick
Asymptomatic
Estimated infected
Known New Deaths
05/01/20
229
229
50
279
10
05/02/20
109
338
74
412
12
05/03/20
327
665
146
811
7
05/04/20
330
995
218
1,213
32
05/05/20
217
1,212
266
1,478
32
05/06/20
262
1,474
324
1,798
32
05/07/20
404
1,878
412
2,290
13
05/08/20
288
2,166
475
2,641
12
05/09/20
123
2,289
502
2,791
9
05/10/20
173
2,462
540
3,002
5
05/11/20
234
2,696
592
3,288
22
Total
2,696
186
These numbers were pulled directly from the Mississippi Department of Health’s daily updates. And the numbers shown are for May 1st through May 11th. You can see that the total number of newly positive cases is 2,696. In just May alone. And – given the average length of sickness determined by the CDC – all of those people are still dealing with the illness.
Recall that we can use the total number of positive-testing individuals to estimate the number of asymptomatic people, too. While this is still an estimation, it is based on past research and can be a good ‘ballpark’ figure. That number shows 592 asymptomatic people right now in Mississippi.
Asymptomatic are people who are carriers, but show zero signs of symptoms and can still pass the virus along to others. That gives an estimated total of 3,288 people infected. Maybe a little more more. Maybe a little less.
Right now. At this very moment. On May 12th at 10pm.
Have we peaked?
It may, in a way, feel like it. Since the numbers are getting so high when we add an additional 100 or 200 cases to the nearly 10,000 it can feel like adding a toothpick to a log pile. You may even look at the numbers above and think, well, it peaked at 404 new cases on May 7th, so “we have flattened the curve!” But this is probably too small of a sample to decide that.
A longer view may show otherwise.
The above graph is a look back to the start of the COVID-19 cases in Mississippi. But it is looking at the number of new cases per day, not total cases. It is looking at acceleration not speed. This may be a weird analogy, but come along for the ride…
Let’s jump into Analogy Land. In this case, we are going to graph a car’s speed and acceleration on a 1/4 mile track.
Courtesy: CarAndDriver.com
Notice that the speed can still go up while the acceleration goes down – so long as that number is still positive. But the speed cannot go down while acceleration goes up or stays the same. In fact, even as acceleration decreases (until it goes negative), speed can still increase!
You have probably felt this while merging onto the highway. You gun it down the onramp for maximum acceleration to gain a top speed. But once you get to a comfortable speed to merge, you slow your acceleration down to maybe just a small fraction of what it was when you started going. Yet you are still moving at 70mph.
Back to reality, looking at new cases (acceleration) not total cases (speed) on a graph and seeing it flatten doesn’t mean as much as the total cases on a graph being flattened. So while the climb has slowed and the “curve” is “flatter” it isn’t flat yet. And even if it was, that would mean we are accelerating constantly – and that’s bad. In fact, any number of new cases is still an acceleration, so we really need that number to be zero if we want to talk about “flattening” any curve.
Back to the graph…
The top line in yellow shows the number of total people sick on any given day, assuming the 14-day illness time frame and asymptomatic carriers.
The red line below that shows the number of total known people sick on any given day using the 14-day illness time frame, but not accounting for potentially asymptomatic people.
The greyish-blue line that is erratically going up and down are the number of deaths per day – not in total. The dashed line running through it is the 14-day running average for deaths per day.
The greenish line below that is the number of estimated asymptomatic carriers.
The blue line below that is the number of newly-positive people per day. Notice that lines doesn’t change much after about April 8th.
The thick vertical line is an indication for where we are, in time, today. And past that point, if COVID-19 were to miraculously disappear, how long it would take for this illness to pass.
May 26th. If everyone were to freeze, right where they are right now and not move for two weeks, the virus would – given the estimates – be gone. That would be because we would put the acceleration to zero. And the total cases would slowly fall.
Unpacking some numbers
The number of positive-tested people per day has not changed much since April 8th. It has tallied between 200 and 300 per day (with higher and lower outliers) for about the last 4 to 5 weeks. The average number of new cases per day during that time is 233. During that same time, there have been – on average – 11 deaths per day.
Another way to think of it is during the April 8th through May 12th time period, about 22 out of every 104 people who contract COVID-19 end up dead.
That is a death rate of 4.72-percent. It is killing – nearly – one of of every 20 people who contract the virus.
At 4.72-percent, there will be 127 people dead from the 2,696 people who are currently infected.
So while 2,696 people infected may seem like a triflingly-insignificant number next to the 3 million people living in Mississippi – about one-percent – it is the recent death rate that is eyebrow-raising.
The numbers show that since the “Shelter in Place” order was given (April 3rd) in Mississippi, there have been more than 8,500 new cases and more than 425 deaths. That was during the time when people were social distancing and everything was closed.
And even if you look two weeks after the order was given (April 17th), when the people who were sick should’ve been recovered, more than 6,100 new cases and more than 325 deaths have occured. That is after the people who were assumed sick were supposed to get better and this was all supposed to pass. This is also about the time that people started wearing masks out and continued social distancing.
So what are we supposed to do, Nick?
I hear this a lot when I try to highlight numbers to people. Sometimes people are being curious. Other times they ask with sass. And I’m not here to tell anyone what to do. I can only show you the facts and the numbers. This is why we elect people! The goal when we elect people is to pick the person we think can handle situations the best.
I’ll let you decide what to do, on a personal level, given these numbers. It isn’t my place to tell you to do anything more than what the CDC is suggesting.
But I will say that during the last month, in Mississippi, this has been a very deadly month for this virus with nearly 1-out-of-20 people infected now dead. And it makes me really sad to see it. And even more sad when I look at the trends and I don’t see it slowing down much at all.
Author of the article:
Nick Lilja
Nick is former television meteorologist with stints in Amarillo and Hattiesburg. During his time in Hattiesburg, he was also an adjunct professor at the University of Southern Mississippi. He is a graduate of both Oregon State and Syracuse University that now calls Houston home. Now that he is retired from TV, he runs this site and its app in his spare time.