10AM UPDATE:
Tropical Storm #Barry forms pic.twitter.com/FJtPN1IJE0
— Nick Lilja (@NickLilja) July 11, 2019
ORIGNAL:

Alight, now that we have Hurricane Hunter data and PTC2 is starting to get better organized, the computer models are doing a better job at figuring out where this thing may eventually end up.

The cone highlights a decent shift to the east from where we were 12 hours ago. The jog to the east is in response to new data being fed into the models from extra weather balloon launches and the data from the Hurricane Hunters.
And the cone may not be done ‘jogging’ east.
Morning Science
The TABS and the HWRF models may offer the best look at what to expect from PTC2 during the next 48 hours.
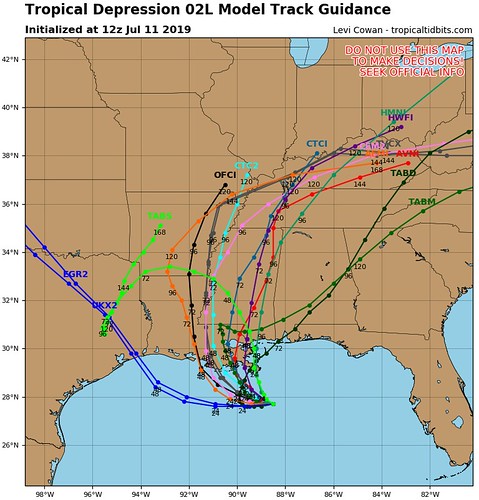
While these two models work differently, they are both picking up on a weaker, disorganized PTC2. One that is sheared and doesn’t have as much of a concentric shape.
The TaBS model works as a guidance model for tracks of tropical systems that are weaker and ‘shallow’ in the atmosphere. That is where the ‘S’ at the end of TABS comes from. I like to use it as a guidance for, “If this storm stays weaker, where is it likely to be nearest?”
The HWRF is a short-term hi-res model that is fed data from the Hurricane Hunters and extra weather balloon launches in the southeast. So it has the best data and the highest resolution output. That helps it – attempt – to produce the most accurate forecast.
Both of those models show PTC2 moving north through – roughly – New Orleans and into Mississippi.
And even the HRRR model is starting to show a similar potential. Take a look at what happens to the ridge in the mid-levels during the day today:
Courtesy: Pivotal Weather via GIPHY
The two blue ‘H’ represent the two ridges of high pressure. The yellow lines are isobars (lines of similar pressure). Notice how the yellow lines to the NW of PTC2 in the Gulf move west and the lines on the east side of PTC2 also move west. This is a quick indication that the steering current may favor a more northerly track in the short term.
While that is only showing one layer of the atmosphere, the HRRR model also shows a similar occurrence higher up in the atmosphere, too. Meaning that even if PTC2 was to strengthen, and was more susceptible to steering currents at higher altitudes , the ridge is also breaking down at those levels, too.
So now we have three models in agreement. What happens if we get a fourth? And a fifth?
The GFS is showing something similar on the 6z run, but I’m holding out until the 12z renders before including it here.
What happens if it keeps going east?
There may be an eventual model that kicks the Pine Belt onto the central to western side of the system. That would really diminish our flooding risk and wind risk.
What is the likelihood of that happening?
Really low. But not completely zero, either.
Things I’m getting concerned about
The more this shifts east, the closer South Mississippi & southeast Louisiana gets put in the bulls-eye for flooding.

The key messages, as of this writing, from the National Hurricane Center. They are concerned about storm surge and flooding from an intensifying storm as it makes landfall is the – generally – less populated coast of central Louisiana.
These key messages may change quite a bit if the center of the storm is farther east and the southerly and southeasterly flow at the surface is piling water into the mouth of the Mississippi and Pearl rivers while also putting those same areas in a space where 10″ to 20″ of rain is also possible.
Also, the slow movement of this system is also concerning. Trapped in-between ridges, if PTC2 isn’t ‘picked up’ by the trough in the Great Lakes, this thing may be very slow to mosey out of the area. That could exacerbate the flooding risks.
On top of all of that, Rapid Intensification is another thing that is concerning given the proximity to the coast. It is pretty close to land and if it gained a lot of strength in a short period of time, it woulc put a lot of people in danger.

Right now the numbers aren’t crazy high, but seeing RI numbers that are 3x higher than the climatological mean aren’t exactly comforting either.
What does this all mean for you?
This is probably a good reminder that until we get Hurricane Hunter data and a defined (even loosely) center, forecasting these things can be difficult. And there can be subtle changes to track that may have major changes to impacts.
Rain
Parts of Louisiana and Mississippi are going to get drenched with about 2 inches to 20 inches of rain. With some spots picking up as much as 25 inches of rain. And there could be some places that get even more, depending on how the feeder bands set up.
I know 2 inches to 20 inches is a pretty wide spread, but across the region, that is going to be the spread.

Model guidance continues to show the potential for even more rainfall in some places this morning. And I anticipate the WPC will continue to increase the rainfall forecast as they did this morning from last night.
Here is another look at the list of places from yesterday with update rainfall estimates based on model guidance, and not the official forecast from the WPC:
Louisiana
New Orleans – 10+ inches
Baton Rouge – 12+ inches
Lafayette – 6+ inches
Alexandria – 6+ inches
Lake Charles – 3+ inches
Shreveport – 2+ inches
Mississippi
Gulfport – 10+ inches
Hattiesburg – 7+ inches
McComb – 7+ inches
Jackson – 5+ inches
Meridian – 6+ inches
Tupelo – 2+ inches
Wind
Hurricane-force wind won’t be as much of a concern inland. Instead, Tropical Storm-force wind will be the concern for inland areas of Louisiana and Mississippi.
The NHC forecast is for (eventual) Barry to strengthen to a hurricane with winds around 80mph, but those winds will only be felt along the immediate coastline within 20 to 30 miles of landfall – if not even closer. Everywhere else can anticipate weaker wind. And the further inland you travel, the weaker the wind will be.
Given how slow the storm is currently moving and the forecast form the NHC as well as model trends… if you live 50 miles inland from the coast, you can anticipate your sustained wind speed to be cut in half from the observations on the coast. Live 190 miles inland? take off another half from that.
So a Category 1 Hurricane on the coast with 80mph wind will only produce a 40mph sustained wind 50 miles inland. At 100 miles inland? A 20mph sustained wind. Now, keep in mind, wind gusts can reach up to 20mph higher than the sustained wind speed with this system.
Surge
I don;t often talk about surge with my coverage area being so far inland, but in this case I wanted to touch on it quickly.

This is the inundation map from the NHC that shows some areas along I-10 in Mississippi NE of Slidell under -up to – three feet of water. Not from rain, but from storm surge.
This is what the NHC warns:
The combination of a dangerous storm surge and the tide will cause normally dry areas near the coast to be flooded by rising waters moving inland from the shoreline. The water could reach the following heights above ground somewhere in the indicated areas if the peak surge occurs at the time of high tide…
Surge-related flooding depends on the relative timing of the surge and the tidal cycle, and can vary greatly over short distances. For information specific to your area, please see products issued by your local National Weather Service forecast office.
Forecast: Mouth of the Pearl River to Intracoastal City…3 to 6 ft
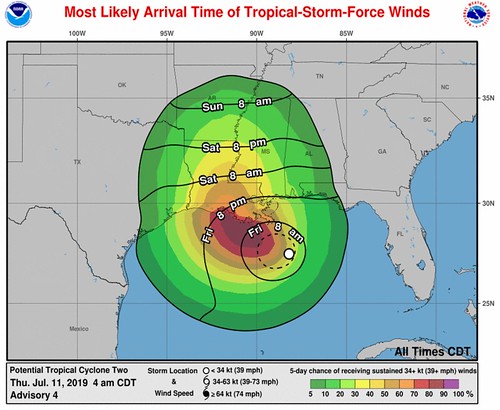
Timeline
This is a very slow moving system that is trapped between three different amtospheric features. It isn’t going to be in a hurry to do anything – move or strengthen.
Storm timeline
Thursday – Likely a Tropical Depression while organizing itself further and strengthening south of the Louisiana/Mississippi border in the Gulf, moving west
Friday – Possibly a Tropical Storm, at least a Tropical Depression given latest model data south of Thibodaux, Louisiana moving northwest approaching land
Saturday – Likely Tropical Storm or weak Hurricane, making landfall somewhere between Lake Charles, Louisiana and New Orleans, Louisiana, during the mid-day hours, moving north
Sunday – Inland
Impacts Timeline for South of I-20
Thursday – Showers and storms in Louisiana, Mississippi and Alabama loosely associated with (eventual) Barry
Friday – Storms in Louisiana, Mississippi and Alabama associated with (eventual) Barry, some flooding possible along the coast withing 40 miles of the Gulf across parts of Louisiana and Mississippi
Saturday – Heavy rain in Louisiana and Mississippi associated with (eventual) Barry, flooding possible, downed trees possible, power outages possible, tornadoes also possible
Sunday – Heavy rain in Louisiana and Mississippi associated with (eventual) Barry, flooding possible, downed trees possible, power outages possible, tornadoes also possible
How can I prepare now, Nick?
If you live in a flood-prone area, assess your surroundings. Is the creek near your house clear of debris? Are the storm drains clogged? Fix those things now. If a Flash Flood Emergency was issued for your area, do you know where to go? Find a safe place from flooding now.
Don’t feel safe in your home during bad weather? Reach out to a friend! Go hang out at their place this weekend.
While this isn’t anticipated to be some Monster Hurricane, prolonged rain can cause serious problems. Flooding is the deadliest form of severe weather. It kills more people than tornadoes. So please take it seriously.
Also check your Hurricane Preparedness Kit. That’s about it. Make sure you have enough supplies to last a few days without power and water. Not because this system is anticipated to wipe out power and water to an area, but rather, you should always have enough supplies to last a few days without power and water during Hurricane season.


