Using the database of information offered by the National Weather Service (NWS) in Amarillo, Texas, the number of tornado reports and tornado days was established. From there, the number of “Spring” tornadoes was established removing all tornadoes before February 1 and after July 1.
The previous fall and winter precipitation was also obtained from the NWS office in Amarillo. The October to April monthly precipitation data was used.
Then data was collected from the Climate Prediction Center for El Nino / La Nina years and sea surface temperature (SST) anomalies. Data was also collected on Gulf of Mexico and Gulf of Alaska SST through the Office of Satellite and Product Operations site from NOAA.
Given the data available for Gulf of Mexico (GoA) and Gulf of Alaska (GoA) was generalized data pulled from SST maps, it was given either a +1C, 0 or -1C reading. That number was a rounded average from three points in each body of water. There was also missing data for the fall of 1996 so the averaged numbers from the other years collected for the months of Oct, Nov, and Dec, were given to those months with missing data.
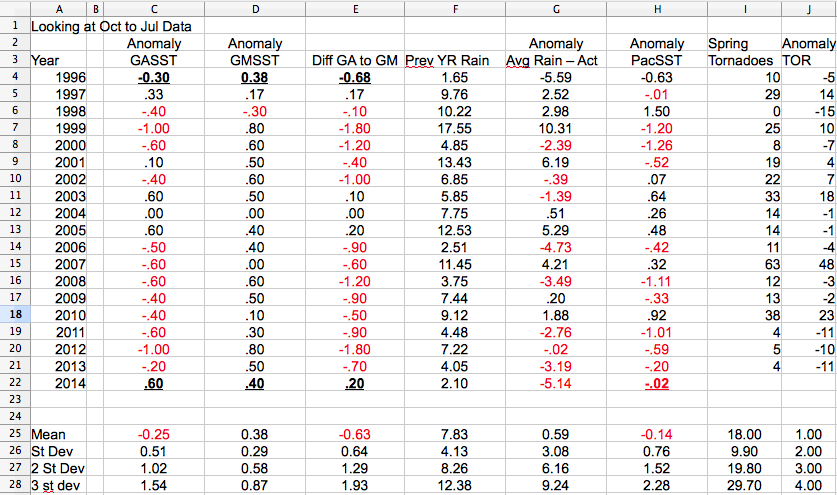
This data was plotted onto a spreadsheet. The data was then averaged seasonally to the “current” year as follows:
What – When – How Much is Average
Tornadoes – Current Feb 1 – Current Jul – 1 15
Precipitation – Previous Oct 1 – Current Apr 31 – 7.24”
ENSO Anomaly – Previous Oct 1 – Current Jul 1 – 0.00
GoM Anomaly – Previous Oct 30 – Current Jul 30 – 0.00
GoA Anomaly – Previous Oct 30 – Current Jul 30 – 0.00
The averaged information was then moved to a different spreadsheet and listed for each year. It was important to keep all readings as anomalies for comparison purposes so the Precipitation and Tornadoes categories needed to be averaged and given anomaly readings, too.
For the 18 years of data available, 1996 to 2014, the average for each category across all years was taken. Then the first, second and third standard deviations calculated, too.
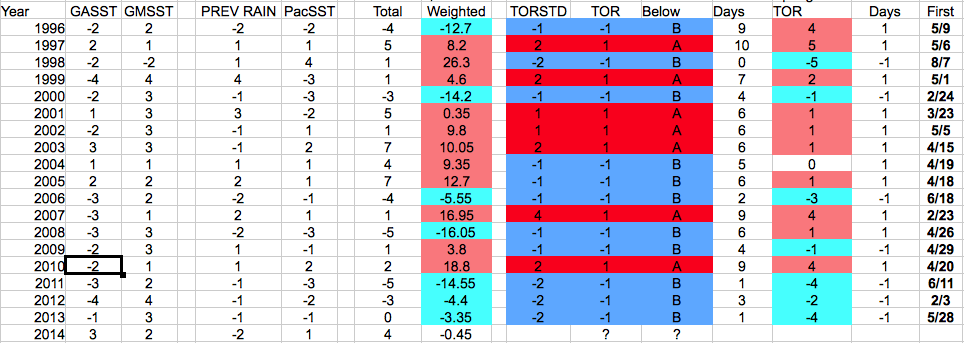
For each anomaly, the measure of standard deviation was plotted into a new spreadsheet. From 1996 to 2013 GoA, GoM, Winter/Fall precipitation, ENSO, and spring tornado stand deviation data was recorded.
Then each was assigned a weighted total from previous scholarly research conducted regarding the influence that each category has on spring severe weather. Previous research showed a connection between GoA SST and the number of tornadoes, GoM SST and the number of tornadoes, soil moisture from previous fall / winter rainfall and the number of tornadoes, and ENSO and the number of tornadoes.
What & Connection
Previous Precipitation – Unknown
ENSO – Unknown
GoA SST – 15% increase per 1C decrease in SST
GoM SST – 51% increase per 1C increase in SST
Generalizing the above statistics and applying regional bias the “Previous Precipitation” was given a “Connection” of “3” for every one standard deviation from the mean and “ENSO” was given a “Connection” of “6” for every standard deviation from the mean.
So the equation ends up looking like:
-1(1.15 x STDEV(GoA) ) + (1.5 x STDEV(GoM)) + (3 x STDEV(Previous Precipitation)) + (6 x STDEV(ENSO))
Multiplying the GoA reading by negative one is necessary as a colder temperature in the GoA leads to an increased chance for tornado days.
The rationale behind the – seemingly arbitrary – numbers is that soil moisture was found to be more influential than any other factors in previous research – except ENSO. So assigning a value of twice as much influence as the GoM SST to precipitation seemed appropriate, and assigning ENSO a value twice the value of precipitation seemed appropriate, too.
Further massaging of these numbers could prove helpful, but for the purposes of this study weren’t necessary.
Once the weighted total was calculated it was then compared against that season’s tornado days and total tornado numbers.
Again, the weighted totals of the standard deviations from the mean of the anomalies of GoA SST, GoM SST, Previous Precipitation, ENSO SST were compared against the total number of tornadoes and the number of tornado days for that year.


