The Fourth of July is always a big outdoors holiday – between barbecuing and fireworks, a lot of us are looking for a dry, not too hot day.
Currently, looking this far out isn’t exactly sound meteorological science. It is often, when looking beyond Day 10, it is about model trends, ensemble data, and global oscillations and patterns. It is more about “warmer / cooler” than offering exact numbers and a forecast.
From the CPC
Here is the outlook from the Climate Prediction Center ending on July 5th:
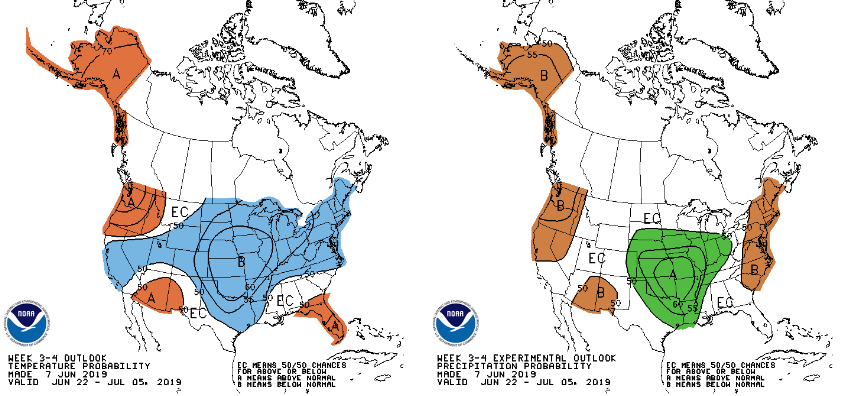
Helpful. But not nailed down enough to a specific day. And that is fine. Trying to nail down an outlook to a specific day doesn’t offer much accuracy. But since you asked, we can give it a go and see what information we can try to pull out of the data.
Looking through the data
Seven of the last 12 model runs (about 60 percent) of the CFS Deterministic model have pegged a “cold” front sliding through the eastern United States on the Fourth.
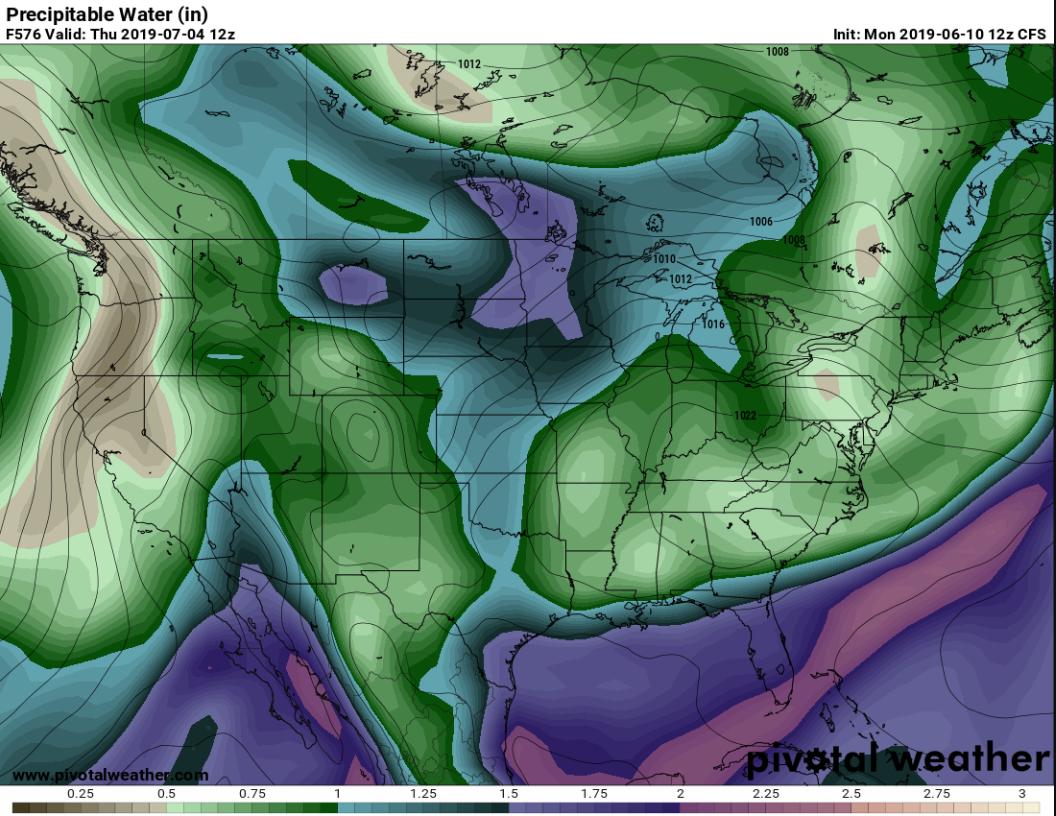
The map shows Precipitable Water values. This is a good indicator of how much moisture is in the air. The lower numbers means it is drier, the higher numbers indicates more available moisture (humidity) in the air.
You can use this to identify a lot of cool weather stuff. In this case, it is a good indicator of where the cold front is located (as an aside: In this case, the term “cold front” is being used technically, and not literally. Sadly, no “cold” air behind cold fronts in July. But it is coldER air. And thus, technically, a cold front).
Notice a stark change in PWAT values (from dark blue and purple to lighter green) on this model depiction. The sharpest change occurs along the Gulf Coast and out to sea off the East Coast. That sharp change in PWAT is the indicator that a front is nearby.
The blues and purples the go up the east side of the Rockies and up into the Dakotas and Minnesota is a response on the backside of the cold front that kicks off the Gulf Coast. Return flow pulls higher PWATs back north and into the Upper Midwest.
You might say, “Well, Nick, that is only one model.”
And my knee-jerk response would be, “YES! I am so proud of you for being skeptical of only one model! That is a great point.”
I would likely follow that up with an explanation that looking at successive model runs to build a trend is a good way to start a forecast, but it can’t be the end-all-be-all. Only looking at one forecast model to put together a forecast or outlook, is like marrying the first person you ever date. Occasionally, it works! But most of the time, not so much.
So, let’s look at the CFS Ensembles.
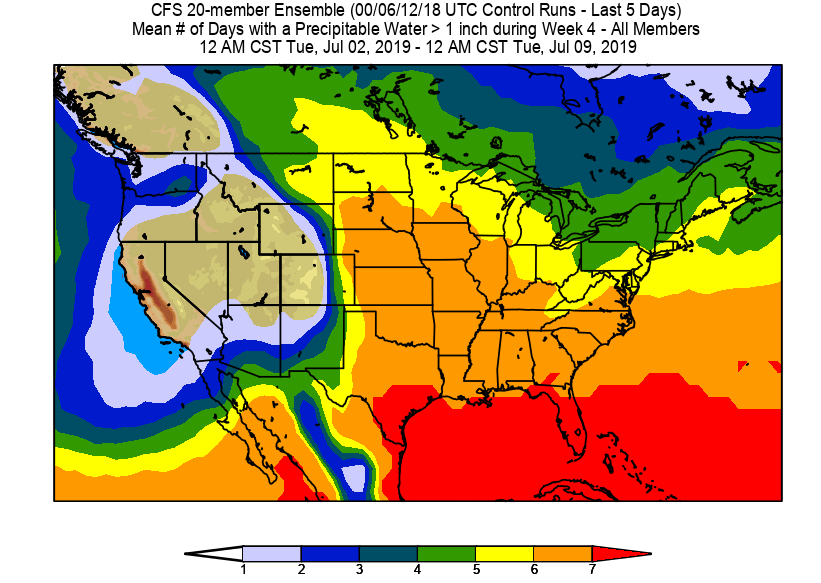
This map shows how many days between July 2 and July 9th will have a PWAT value above one inch. And one inch is a good measure of when things start to feel pretty humid. It is also a good proxy for pre- and post-frontal. A lot like before, the higher the number, the more likely it is to be “pre-frontal” and under the influence of more heat and humidity. Post-frontal is behind a cold font and more likely to be cooler and drier (terms used loosely).
Generally, most of Eastern United States is experiencing PWAT values of near or above 1.0″ by July 1st. That means the “average” map should have the deeper red color covering places like Texas, Oklahoma, Kansas, Arkansas, Missouri, Tennessee, Kentucky, Mississippi, Alabama, Georgia, North and South Carolina and Virginia. At least.
Seeing this Ensemble map showing that red color down into the Gulf would suggest the model data shows a front with cooler and drier air (again, used loosely) into the region.
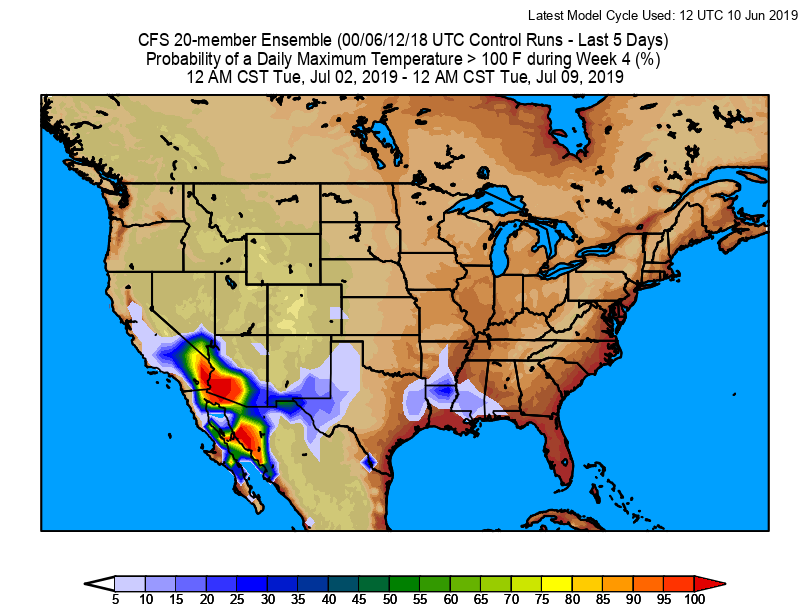
I use the term “cooler” very loosely because the same model guidance shows a shot that there could be areas in the triple-digits.
Outlook by region based on available data
PacNW:
About average
Southwest:
Hot. Some storms possible.
Rockies
About average. Better chance for rain north.
Upper Midwest
About Average with extra humidity. Storms possible .
Southern plains
Hot. Humid.
Southeast
Not as hot. Not as humid.
Great Lakes
About average. Nice.
Northeast
About average. Nice.
The ‘Take Home’ point
But again, this is all way-too-early stuff. Don’t make plans off of this, just keep this rolling around in your head during the next few weeks. That there is a chance that some areas luck out and get a nicer Fourth of July. While others… may not.


