I received a great question from a viewer on facebook the other day about the forecast. The viewer asked if the Storm Prediction Center underestimated the severe weather threat on Sunday, given the multiple tornado warnings as well as the crazy video showing the tornado moving through Fort Walton Beach.
The National Weather Service in Mobile rated this as an EF-1.
Public Information Statement
National Weather Service Mobile AL
708 PM CDT Mon Apr 23 2018…NWS Damage Survey For 04/22/2018 Florida Panhandle Tornado Events…
.Fort Walton Beach, FL Tornado…
Rating: EF-1
Estimated Peak Wind: 100-105 mph
Path Length /statute/: 1.24 miles
Path Width /maximum/: 50 yards
Fatalities: 0
Injuries: 2Start Date: April 22, 2018
Start Time: 4:13 pm CDT
Start Location: Okaloosa Island
Start Lat/Lon: 30.3963, -86.6230End Date: April 22, 2018
End Time: 4:18 pm CDT
End Location: Fort Walton Beach
End Lat/Lon: 30.4136, -86.6174Survey summary: The tornado moved ashore on Okaloosa Island and produced
significant damage to a home on Sailfish Drive. The tornado then moved
across Santa Rosa Sound and into Fort Walton Beach, producing tree damage
and broken windows at St Mary Catholic Church and School. The tornado
continued northeast across Robinwood Drive and damaged the roofs of several
units in an apartment complex, before finally weakening and lifting just
north of Jet Drive.
While it did a fair amount of damage, and the video is pretty intense, it was still only an EF-1 tornado.
Was this setup under-estimated? Let us start with the forecast sounding from the NAM-3km that morning:

Not exactly the most prime setup for severe weather and tornadoes according to the modeling. But a typical low-CAPE / high shear day along the Gulf Coast.
But, to get some context, lets take a look at history…
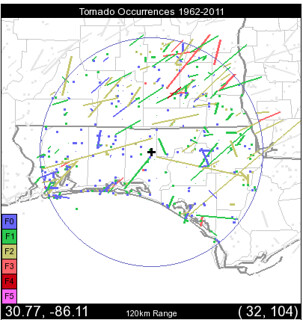
The map shown is a snapshot of every tornado in the area between 1962 and 2011. Notice that there are a handful near the coast, but most of the tornadoes in this area are further inland. And most near the coast have been rather short-lived (as they are dots rather than longer lines).
The map shown is pulled from the Storm Prediction Center Tornado Environment Browser page (I used the page – and the research behind it – to help me come up with the Karrie Meter).
The SPC Tornado Environment Browser offers a peek into what the atmosphere was like for all of those tornadoes, too. It can be very helpful for identifying whether or not the atmosphere is conducive for the development of severe weather.
In the graphic below, take a look at what the local parameters are to create any tornado. The box-and-whisker plots show the lowest values, highest values and all of the values between, too, averaged out with mean, and the 25-percent and 75-percent quartiles.
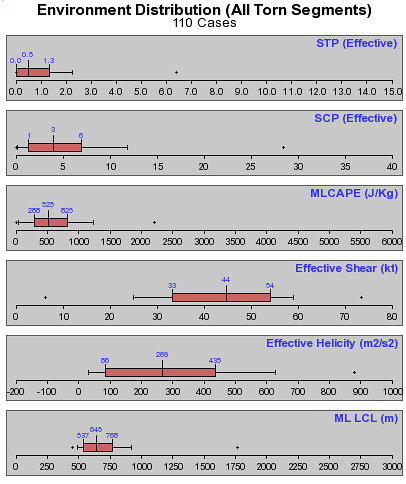
Notice that the lowest value to create a tornado for the first three parameters are all close to – or at – zero. That is pretty incredible. And thus, very hard to forecast.
The remaining three have a wide range. Shear is as low as 25 or as high as almost 60. Helicity is as low as 30 and as high as 630. And ML LCL is as low as 400 and as high as 900.
So in the case of the Fort Walton Beach Tornado, the range of possible atmospheric conditions that could lead to a tornado are quite broad and – in some cases – simply have to be above zero.
Okay, now that we know what the atmosphere can look like to make a single tornado, what might it need to look like to make a significant tornado?
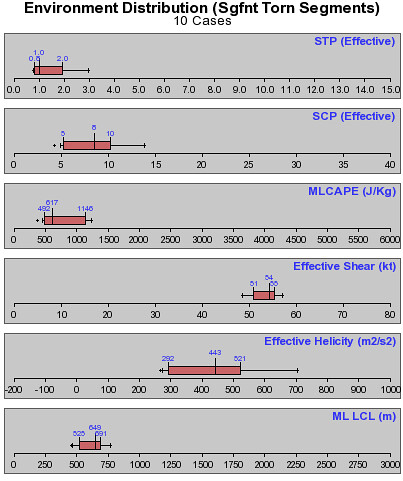
Here we at least get the first three parameters above zero! But the range for four of the six is still pretty large. The only places where it isn’t is the Shear (between 48 and 57) and the ML LCL (between 475 and 760).
Given the forecast sounding, I’d say the forecast looks decent to me. It is tough, for sure, though.
Short-range modeling gave an even better look at the area, though.
Not hard to see why the general tornado threat was higher for the area. And perhaps the SPC did under-estimate the threat. But, historically, because the numbers (in the graphics above) have such a wide range, it can be difficult as forecaster to peg an area with a threat for something specific.
And it got meteorologists in the area talking on twitter, too.
So what is the answer to the viewer’s question? Honestly, I don’t know. Perhaps they under-did it. But given the historical numbers and the current setup, I think the SPC and local NWS offices did well. Because man, that’s tough to nail down.


