I received a great question the other day. Corey checked in asking if the overall pattern had changed during the last few years since it felt like there hadn’t been as much severe weather.

And I like this question for many, many reasons. The biggest reason is because it means I get to look up data on severe weather and tornadoes. But I also like this question because Corey is doing what I think is the best part about science… He is challenging a feeling.
Whenever I hear people say, “It feel like “XYZ” is happening more than it used to,” I always want to jump in and say, well why don’t we look up some data and try to find a trend? Or just ask someone who actually has the answer? Or do something to see if what you are feeling is accurate?
The only feelings in science are the feelings you get when a hypothesis is accepted or disproven.
Getting back to Corey, he said it ‘seems’ like there isn’t as much severe weather. And instead of just being fine and dandy with his feelings, he wanted to know if that feeling is accurate, and if the change he feels is due to a change in the weather patterns.
Challenge a feeling and proposing a hypothesis! This guy is pure SCIENCE!
Looking at the data
While we can’t parse the data down to a handful of counties, we can look at the state of Mississippi as a whole.
We can look back at the data from 1986 to 2021 and see how many severe thunderstorm warnings and tornado warnings were issued each year. This is a good way to check our feelings, right? Because the more severe weather, we can assume, the more warnings from the National Weather Service.

And looking back to the 1980s, you can see three camps across all of those years.

We’ve had six years of ‘more’ severe weather, a bunch of years of ‘some’ severe weather, and eight years of ‘fewer’ severe weather events. And most of the recent years fall in the ‘some’ camp. So we are going to have to dissect things a bit further.
Looking back to 2012, data show that there have been about 600 to 800 Severe Thunderstorm and/or Tornado Warnings across the state. The two graphs below have two different scales due to an outlier, the year 2012, that had an active Summer of warnings.


And that highlights an important point. When Corey asked about severe weather, he said “Winters” and since our severe weather season runs from October to May, he is likely singling out November through February.
So we probably need to pick out the number of warnings that were during the winter only. And for that, we need to take an extra step…
In Winter
So, instead of just looking at the total count of warnings, like below.

We need to get inside that data, and pick out the warnings by month. And for that, we need the data for warnings by month.


Notice that some years are heavily skewed by higher numbers of warnings during the summer. Sometimes this is related to landfalling tropical systems (tornadoes in 2005) or more active summertime thunderstorms (severe thunderstorms, 2011).
So pulling just the winter data from the two above datasets and you get this (click here to see a bigger version of the image below)

On the bottom, the Total, Average, and Standard Deviation are important numbers. Because these tell us a lot about severe weather in the Winter, statistically.
When you add both together and run the numbers, there were a total of 6233 warnings from 1986-1987 through 2021-2022 (the current winter, as of this writing). On average there are 173 warnings per year. And the Standard Deviation is a whopping 95.
Recall that Standard Deviation is a quick way to find out how variable the numbers are from one year to the next. So, a Standard Deviation of ’95’ means that the average difference in total warnings from one year to the next is 95 warnings.
So when the average is 173, but the standard deviation is 95, it means the average variation year-to-year is somewhere between 78 and 268 total warnings.
That may sound like a pretty wide spread, but when you see it on a graph, it may start to make more sense.

Last year and the winter of 2016-2017 were both below that lower Standard Deviation line. The 2016-2017 winter was the first time we’d been there since the winter of 1992-1993! And then we did it again last year. Sandwiched between those two, were two years that were above-average, though.
So, on the surface, it does seem like the last few years have been less active. Even this winter, in 2021-2022, we are hovering below the lower Standard Deviation. Though, the Winter isn’t done yet. And January and February carry – on average – 53-percent of the warnings during Winter. So, if we have an average rest of Winter, that does put us over the threshold and into ‘average’ territory.
Connecting the dots
When trying to identify if something is truly anomalous, we need to define our domain. We have two of the last four years featuring below-average numbers of warnings, and that is all fine and dandy. But to compare it to overall weather patterns, we need to know how far back to look and where some good analogs may be.
Considering that seven of the last 10 years (not counting 2021-2022) have featured above-average numbers, I think that starting by looking back to 2011-2012 might be fine. At the very least, it is a good place to start.
So let’s take a look at the general weather patterns for those Winters


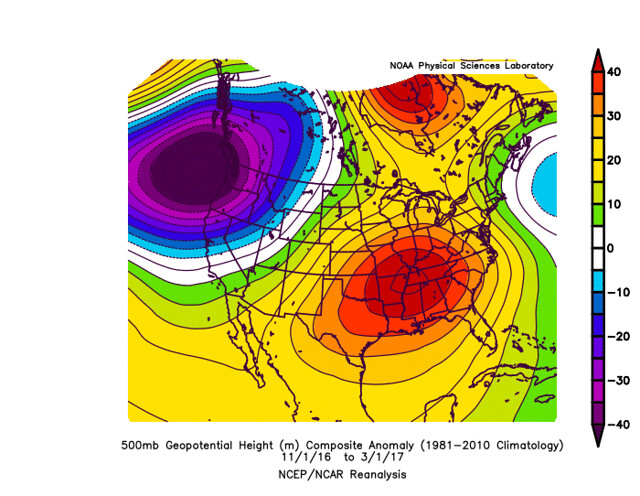


Now, it helps to be a meteorologist when looking at those maps. But even if your not, you can just look at the colors and see if there is any pattern to the placement of the colors versus the number of warnings.
And the short answer is, “There isn’t really a pattern.” The long answer is, there is sort of a pattern. But you have to look a bit farther back in the data.
If you lay all of the Winter’s back to 1986-1987 with more than ‘1 StDev from the Mean’ on top of each other, you get this map below. That is to say, when the Winter 500mb map looks more similar to that map, you are more likely to see an active winter.

And when the general map looks like the map below, you are more likely to have an inactive Winter.
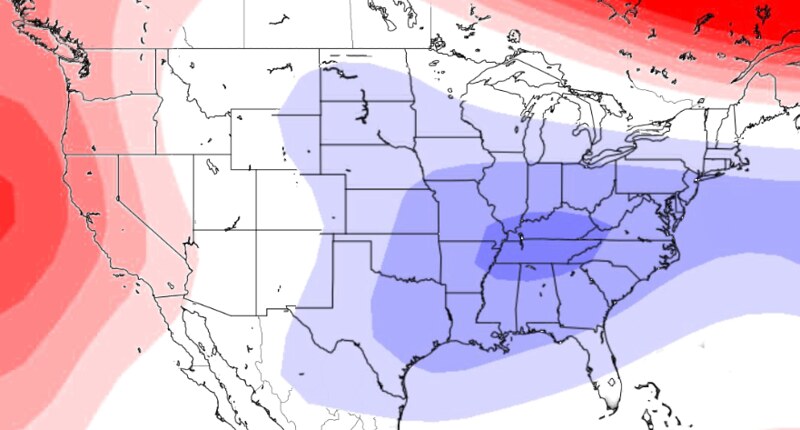
And looking back at the two most recent inactive winters, you see there is some resemblance in 2020-2021, but not as much in 2017-2018.
So what’s the answer?!
So to the question, ‘are the winters the last few years less active than the winters 4-5 years prior?’ I have to set a few boundaries first.
I would consider “Few” about three or four. And since he asked about few vs. 4-5 I’m going to compare 4 to 4.
The last 4 years (2017-2018 – 2020-2021), we have average 127 warnings per year.
The 4 years prior (2013-2014 – 2016-2017) to the above periods, we averaged 233 warnings per year.
So, yes. There have been fewer warnings. It turns out that both 2015-2016 and 2016-2017 were both Top 5 severe weather years for Mississippi. So, goodness I’m glad we aren’t as active.
To answer the question, ‘is this luck or a pattern change?’ is a bit more difficult. The four years prior were very active. In fact, looking at the running five-year average for the number of warnings, the winter ending in 2016-17 marked the most active five-year stretch of severe weather in Mississippi dating back to the mid 1980s.

So, the answer is a mixture of, pattern change, luck, and a bit of we-just-couldn’t-keep-that-pace-up.
Can we use this info for anything?
We can try. Since this winter does look a bit like The winter of 2017-2018 above, we can try to make a bit of a prediction.

It is probably safe to say that the weather so far has looked a bit like that year – albeit, not quite a cold. And that year featured a few severe weather events in January and February, too. But it could go down as another year with below-average severe weather.
But more often than not, the potential for severe weather manifests from short-term weather scenarios and not ‘big picture’ weather patterns. For example, Sunday is not an A-typical severe weather setup, but we may have a few severe storms – and thus some warnings.
So as mcuh as we can try to say the current pattern isn’t as conducive for severe weather generally, it doesn’t mean that it won’t happen ever at all.


