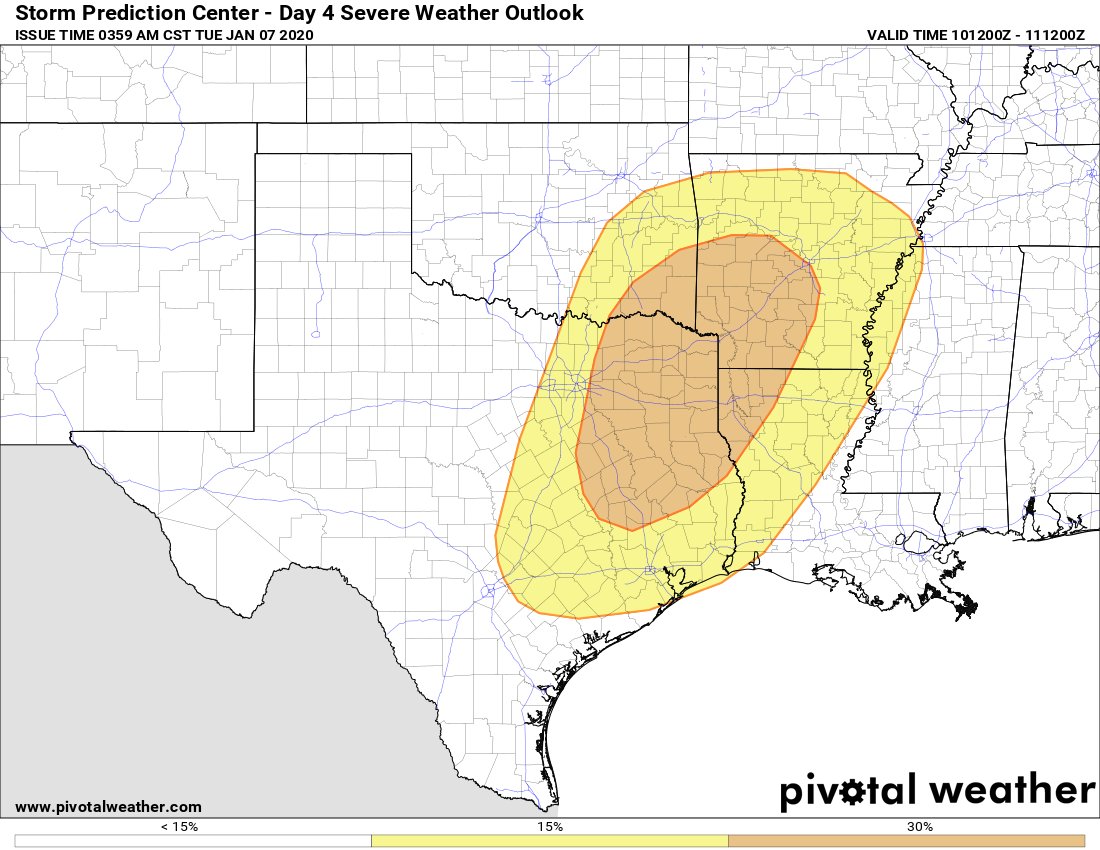
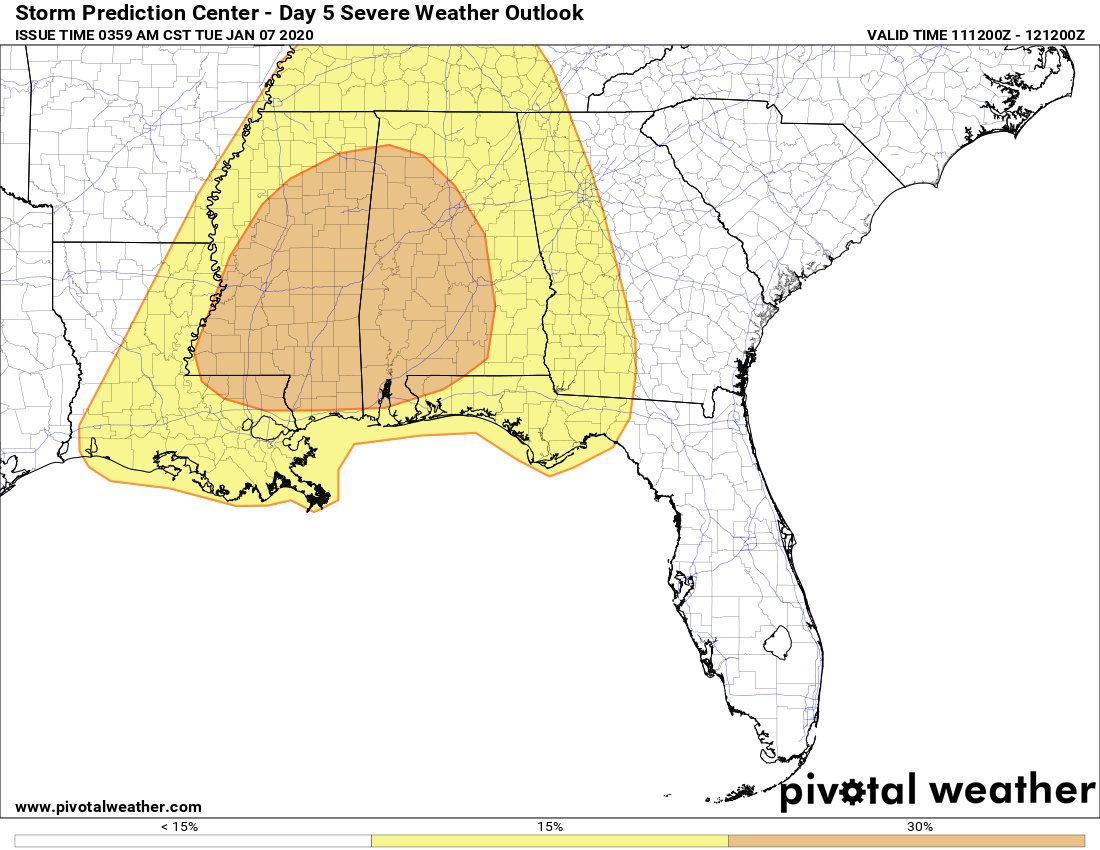
Welp… Another day, another update. Today I want to pull some of the analogs to highlight how past setups have faired. Before we get there, though, here is a quick snapshot (hat tip to Pivotal Weather) of the risk areas.
The Analogs
The CIPS Analogs have been a very useful tool in the past. In fact, it helped us ID the threat for severe weather in January of 2017 more than 10 days out. In this case, it also picked up on the threat for severe weather more than 10 days out.
We were talking about this threat last week. In fact, it was first highlighted (though, I don’t have the clip) before New Year’s Eve, too. Teh CIPS Analogs have been a great tool to help ID things down the road. In this case, the Extended Analogs look at more than 100 members, utilizing the Top 5 more similar past events to what the model data is suggesting. It then looks for severe weather reports on those days and highlights the areas where those reports are tallied.
The numbers coming back this morning, Tuesday, January 7th, aren’t as robust, but are still cause for concern.

Notice the bullseye of higher percentages along the I-20 corridor in Mississippi between Jackson and Meridian. That is telling us that in the past, under similar sets of atmospheric circumstances, that – at least – five severe storm reports were documented in that area.
For those concerned about another devastating, long-track tornado. The CIPS can peek into that window, too. It shows a 20-percent area in Alabama.

That shows that in the past, under similar circumstances that a long-track tornado occured 20-percent of the time.
Understanding Risk
Please know that looking at analogs doesn’t mean there is a 20-percent chance for a tornado. It means that similar situations in the past have produced a long-track tornado 20-percent of the time. Please remember that every next thunderstorm is different. While we can look to the past for guidance, it cannot give us guarantees.
Looking at the shorter-range probabilistic version of the CIPS Analogs, it shows a 30-percent probability of severe weather in an area over Mississippi

That would line up with what the SPC is suggesting for a severe weather risk, too.
Underneath the hood, the shorter-range CIPS Analogs is suggesting this is more of a wind event than a tornado threat.

CIPS highlights parts of the area with a 2-percent tornado risk. That is curiously low given the higher overall severe risk, but would indicate that historically events like this produce more wind than tornadoes.
This is in direct contradiction of the longer-range CIPS example shown above. So, there are still some details needed to be hammered out.
How good is CIPS, really?
Let’s take a peek at the last event, December 16th, 2019.

That is a look at the probabilities from CIPS on the top two rows and the outcome on the bottom row.
For that day, the CIPS probabilities for five days out (same forecast hour as the CIPS forecast for our upcoming event) looked like this:

And the tornado threat looked like this:

At this point, it also showed a 2-percent tornado risk. Though, it has a wider area. By the night before, the tornado probabilities looked like this:

So, please keep in mind, things can change.
The final severe reports tally looked like this:

That shape lines up pretty well, but not perfectly, with what the CIPS was projecting at Day 5.
That’s great and all, Nick, but what does all of this mean?
As data continues to come in we are getting a better idea about what to expect. I share this information in an effort to be as transparent with the forecast as possible. I want everyone to understand – fully! – what the data is showing and how we are interpreting it.
For this round of severe weather, there is still some disagreement within the analogs and within a lot of the data. The specifics of the forecast won’t start to really get hashed out until about 72 hours out.
For now, just know that the threat for severe weather remains in place for Saturday for the southeast – Louisiana, Mississippi, Alabama, Tennessee, Georgia, and the Florida panhandle. And while right now, this looks like more of a wind event than a tornado event, that may change.
What part of the forecast can we “lock in”
There is a chance for storm, some severe, on Saturday. That is about all we can “lock in” at this point. The rest is likely going to change a bit.


