The severe weahter threat as we move into this next week looks to be another ‘conditional’ event. Only this time we aren’t going to be waiting on a secondary warm front to give us a ‘marginal’ risk. Instead, this will be a question of ‘boom or bust’ according to some of the early data.
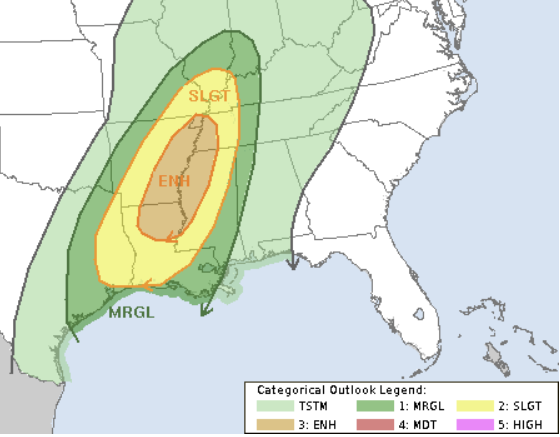
And some of you may be thinking, ‘hey that map has a familiar shape’ because, well, it does. Below was the Day 2 Outlook from the SPC for the December 10th/11th outbreak that produced multiple tornadoes across parts of Arkansas, Mississippi, Tennessee, and Kentucky.
I bring this up to point out that just because two maps have similar shapes, doesn’t mean there will be similar outcomes. Nor does it mean similar ingredients go into the forecast.
A bit like that day, though, it does look like the bulk of the severe weather will be north of I-20 for more of Louisiana, Mississippi and Alabama.
But “most” does not mean “all” which is why I still think the threat for a few severe storms, including a few tornadoes, persists across the region.
CONTEXTUALIZING THE DATA
A quick note to contextualize some of the things you may see shared on social media in the coming 48 hours…
The CWASP maps are making the rounds. That’s not a bad thing. CWASP (something you’ve probably only seen me write about a few times) is a reasonably good indictor for how potent the potential severe weather could be. It is a good way to identify the ‘ceiling’ for an event.
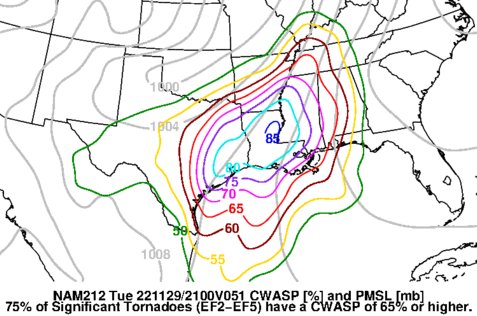
For those who wonder, “just how bad can it get?” this map is a good indicator. As the map says, any time you start to get about a 65 on that map, you start to talk about the potential for some strong and catastrophic tornadoes.
Not a guarantee. Just a ceiling.
Those CWASP maps are often pulled from CIPS Analogs. So its good data! But again, it is a good indicator for the ceiling. But not a good indicator for a forecast.
Speaking of CIPS Analogs, it can give us a good idea about how often these types of setups actually produce severe weather. So, great we know how bad it can get, but how often does it get bad at all?
For this particular setup, it seems to be pretty boom or bust when you look at the top 15 analogs.

For those who have read my updates int eh past, you may remember that the CIPS Analogs looks at the model data for the upcoming event and then compare that model data to the archived data going back to 1979. And it lines up what happened in the past when the atmosphere looked like the forecast data suggests it will look.
Of the analogs, there were five days that featured some pretty “big” events and then three times where severe weather happened but it wasn’t as widespread or significant, and seven times when nothing really happened at all.
And when you look at the numbers, the of the top five most similar situations only one produced severe weather – but it was pretty potent. That was the day an F3 tornado went through Magee, Mississippi.

And that lines up with the CWASP data, right? So we feel pretty good about our ceiling still. But now, we have identified the ‘floor’ to be pretty low. in fact, we have identified it as a day where no severe weather happens at all.
You might be thinking, “That’s not helpful Nick. Either we get a strong tornado or nothing happens?! How do we plan for that?!”
And I will be honest here: You’re not wrong to be frustrated. Anyone who tells you otherwise isn’t being honest with themselves. Because it is similarly frustrating for meteorologists.
One thing we can look at to see how low the floor will be is the general low- and mid-level ascent in place.

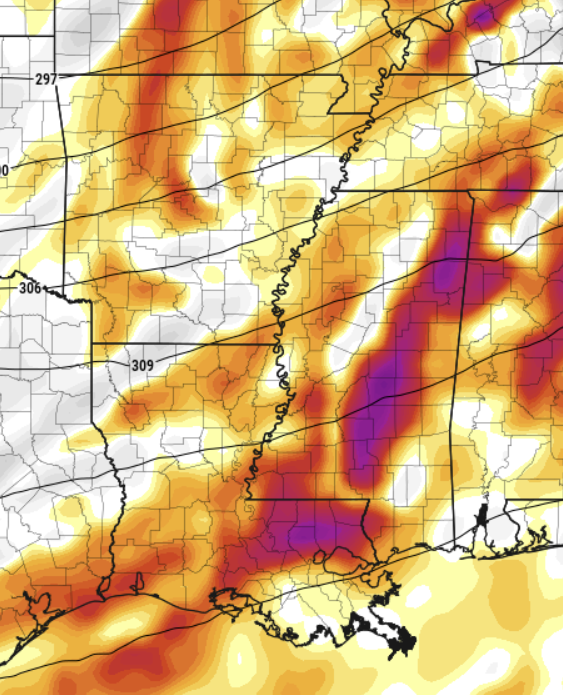
This can give us a good idea about how contaminated the airmass will be. Will storms all of up at once? Will everything be pretty clustered? Is there a sharp boundary causing the forcing?
The short answer here is it looks like the general background ascent will create an environment that may end up – at least a bit – contaminated in many places. But in the spots where the ascent is more localized, there will be a potential for more organized, and potentially discrete, storms to develop.
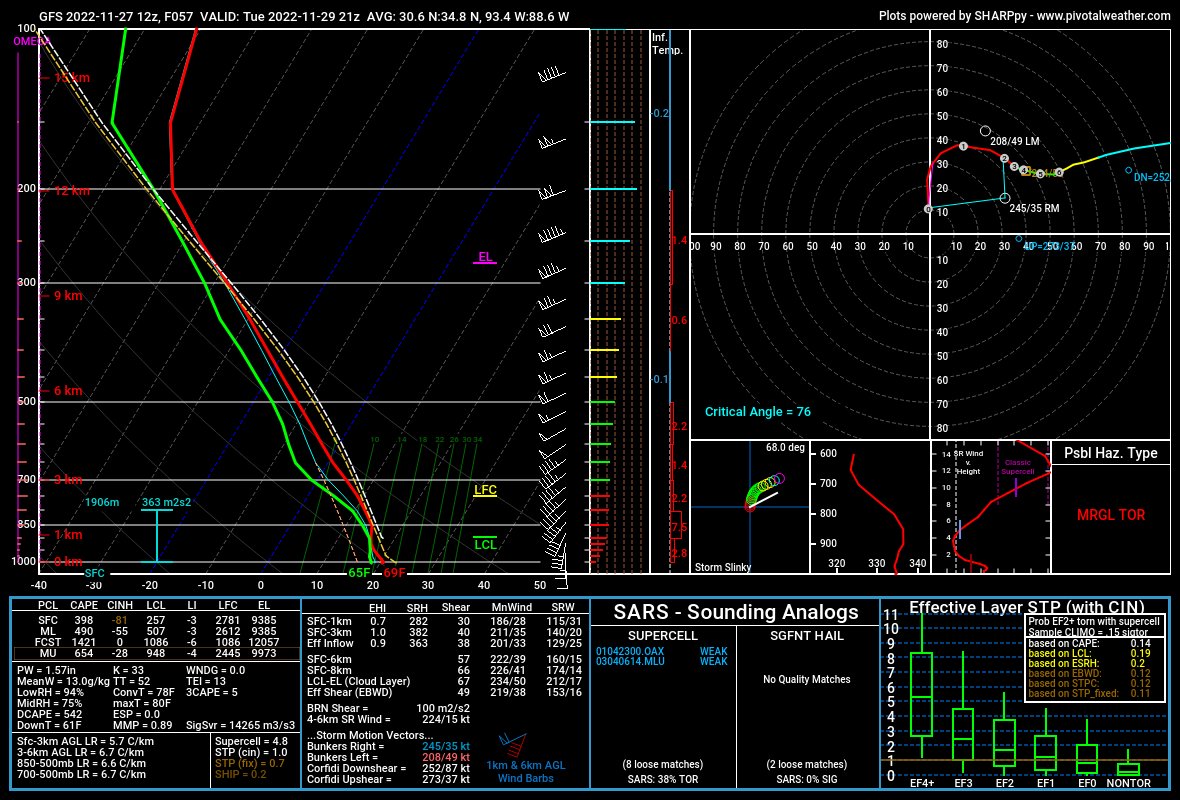
Looking at the forecast sounding for the entire region on Tuesday afternoon/evening there will be a weak cap in place holding back some surface convection from forming, but there are plenty of other parameters that – if the cap is overcome – would be conducive to develop severe weather.
THE BOTTOM LINE
The SPC has designated parts of the region with an Enhanced Risk for severe weather Tuesday and into Wednesday morning. This is a “3” on the 1-to-5 scale where “5” is the highest risk for the most significant severe weather.
In this case, not everyone will see severe weather. It looks like a lot of thunderstorms and rain, but severe weather will be a bit more isolated.
Given the data above, there is a bit of a ‘boom or bust’ scenario that seems to be developing where the risk for significant severe weather is shown in the forecast data, but there is some question about if it will develop. We check a lot of the boxes that would give us a reason to be concerned, but historically speaking there is evidence to support that the worst of the weather only materializes 1 out of ever five times – the last time being in the mid-90s.
And the forecast data we have access too doesn’t really help us – at this point – nail down the specifics of “yes” storms or “no” storms. What it has done, though, is given us the heads up that some of this will be clustered whil other parts will be more organized and potentially severe.
So I think, given this, I would lean toward the “floor” for the region being a handful of severe storms and the “ceiling” being a handful of significant severe storms with a few strong tornadoes. The main threat for the most significant severe weather will be north of I-20 across Louisiana, Mississippi and Alabama. But that doesn’t mean that all of the severe weather will happen there.
Please continue to keep tabs on the forecast during the next 48 hours, I will try to provide updates as often as possible.


