Throughout history, the south has naturally found itself without many white winters and it’s okay. As a normal routine, southerners have gotten comfortable with an occasional cold snap the break up the mild fall temperatures and spring humidity. The infrequent cold temperatures followed by light dusting of frost is why many choose to remain in this region of the United States; it’s what distinguishes the south from the north.
However, imagine the shock when one of nature’s greatest phenomenon, a “nor’easter”, decides to coat the south in thick sheets of ice, blankets of snow and unprepared chaos. Through looking at reports from the 1963 snowstorm; it is evident that the “nor’easter” trend was underestimated and caused much chaos and challenged meteorologist forecasts for being outside of the “average” value sets.
Some Background
A “nor’easter” is defined by a low-pressure system with northeast winds along with the Polar jet stream that lowered from Canada. These storms can occur any time but are most prevalent in the fall through winter seasons along the east coast. However, the same conditions can be adopted for other systems if the location is changed.
Thus, this storm adopts many of the same qualities of a “nor’easter” and this is what brought about most of the surprise to the southern region, many believed these conditions were too bizarre to occur within the southern states, and yet, it did.
Back in 1963, the new year seemed to be bringing nothing out of the ordinary as many meteorologists forecasted average temperatures and neglected to mention snow at all. According to the National Weather Service team members, Mark A. Rose out of Old Hickory, Tennessee and Timothy W. Troutman out of Huntsville, Alabama,
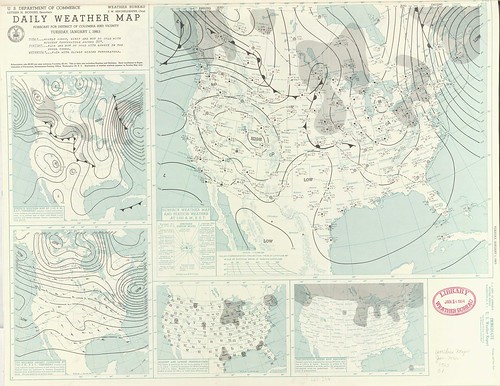
“The surface weather map at 0700 UTC on December 31, 1963 (Fig. 1) showed a developing low pressure system over the Gulf of Mexico, with a trough extending northward from the low into the Appalachian Mountains. A broad area of high pressure centered over the Great Lakes and northeast U.S. was the dominant feature over most of the eastern U.S., and this helped the flow across the Tennessee Valley turn northeasterly.”
Just 12 hours after the charts and forecasts were first seen, new soundings showed the systems moving closer to the west Florida coast and soundings in Nashville, TN began showing that at 0000 UTC on the 1st of the new year, 1964, evidence found below freezing temperatures with precipitable water values at .48″ in addition to a top saturation level at –20c. This temperature with the water available leads to the identification for ice chances as opposed to supercooled rain droplets.
The Change in data
The charts began to show the shift more toward the Mississippi coast; at 500mb meteorologists saw a deep and closed low off the coast of Mississippi and the addition of a second (weaker) low over Arkansas. At 0600 UTC, January 1st, 1964, the surface low turned northeastward driving at the Carolina’s coast. Following at 1200 UTC on January 1st, 1964, the atmosphere below 600mb was entirely saturated with the highest saturation levels at –13c. Based on this data we’re given a look at why the storm took the turn that it did.
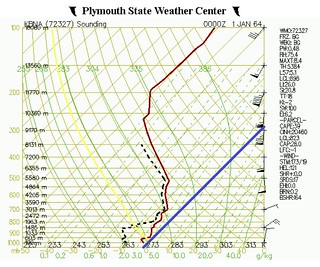
The soundings from Plymouth State Weather Center at 0000z, on the 1st of January shows 700mb at –9 degrees Celsius, at 800mb temperatures are at –3 degrees Celsius, and at 925mb temperatures are 0 degrees Celsius.
Wind speeds at the surface are at 10 knots from the north while winds aloft are upwards of 95 knots out of the southeast.
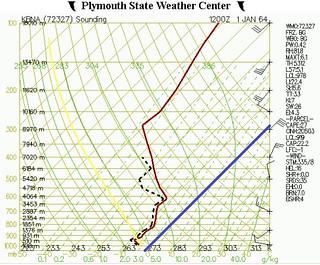
At 1200z readers can see that at 700mb the wet bulb at –9 degrees Celsius, 800mb the temperature is –9 degrees Celsius, and at 925mb the wet bulb is at –9 degrees Celsius again. The inversion at 925 is small and the wind is at 10 knots at the surface with speeds up to 35 knots aloft.
The storm
Mississippi, while not the recipient of the most concerning weather conditions, portions did receive between 15 to 17 inches. The path of the storm out of the Gulf into the Mississippi Delta and through Louisiana, Alabama, and into Tennessee leaving a path of downed power lines, traffic accidents, and fallen trees along the way.
As stated earlier, the south traditionally remains warmer in the winters and don’t see very much snow, therefore; cities in the path of the storm were inadequately prepared to deal with the ice and snow that fell on the cities. While there a few records that were set in Mississippi, Huntsville, Alabama saw 17.1 inches, and this set a record snowfall on a daily, weekly, and monthly spectrum. Over $500,000 were needed to do repairs on highways and transportation.
According to WHNT News 19 reporter John Anderson out of Huntsville, AL, “a times reporter described Huntsville as a ‘paralyzed, helpless city,” and “traffic jams involving thousands of cars backed up on Memorial Parkway and other major and side streets as the wintry blast reached its peak last night. Hundreds of vehicles were abandoned and still stranded today,” the reporter wrote.”
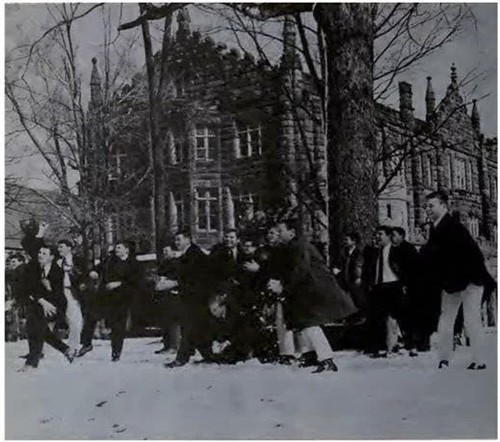
As seen below, University of the South in Sewanee, TN students were thrilled and aghast to see this much snow fall in their town. Anderson also states that John Gordon, Huntsville’s chief meteorologist at the weather service sought to find as much data as he could from the surrounding area to use as training for future storms.
What happened?
As expressed by forecasters, Rose and Troutman, they were confused as to why previous meteorologists were unable to see the large snow amount that would fall on the south. There’s numerous hypotheses as to why they were inaccurate with their forecast. Perhaps they used what Rose and Troutman call “rule of thumb” to look beyond the data and use a more subjective approach based on what they know about the region.
It could also be a result of faulty calculations or incomplete data that today we still as meteorologists’ battle with in ensuring calculations are as accurate as can be.
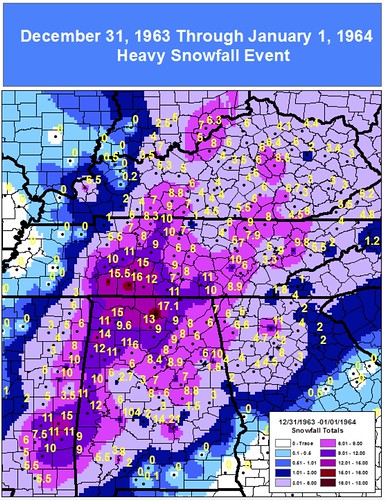
The impact around the south can be seen through various newspapers including The Huntsville Times that claimed the city to be “the nation’s top snow-getter for New Year” which was credited with Alabama’s 17″ snow accumulation. The Pulaski Citizen reported that the snow hit at around 3 p.m. and by 5 p.m. only a half-inch had accumulated but as the wind grew stronger and the system moved closer to inland by late evening a foot had fallen, and the winds caused drifting which piled snow up to knee height in many places. The city found 11.5″ which created a record for the most snowfall in a single day (a record still being held to this day).
The Democrat Union in Lawrenceburg wrote the following day that regarding precipitable water amounts, this could’ve been considered flash flood worthy if it had precipitated as rain. Tennessee had many cities set records for snowfall that remain to this day, Rose and Troutman state, ” Bethpage (7.0 inches), Centerville (11.0), Columbia (15.0), Fayetteville (11.0), Lebanon (10.0), Lewisburg (12.5), Linden (10.0), Mt. Pleasant (15.0), Neapolis/Spring Hill (11.0), Old Hickory Dam (10.0), and Shelbyville (9.0),”
After looking at the forecast by the meteorologists and the actual occurrence, I’ve begun to understand that the problem of weather taking an odd turn and “busting” a forecast is not uncommon and is something that’s been dealt with for decades.
While technology is a large part of the job and we’ve come to rely on it for the most detailed calculations, we find ourselves holding on to what I call a “user error”. This entails how almost all the data could suggest one outcome for the weather, but a forecaster uses what they know to be most probable and what they know is average. Forecasters often do this without even realizing they’re doing it, purely because they see soundings and data for an area so often that it becomes a matter of average versus unexpected.
In summation, the 1963 New Year’s Day storm was such a surprise for the United States and the damage caused was much larger than expected. Meteorologists were unable to forecast this well enough in advance and many cities were inadequately prepared to handle the results from the storm. Three lives were lost, and much money was needed to repair broken cities but all in all, this storm was not massively destructive.
The bigger concern is risen as to why meteorologists were unable to see the magnitude of this storm.
Many still wonder if the human impact in any forecast is the key to removing error in predictions. This snowstorm was such an anomaly for the south and through the years, the south has experienced more snow storms, but the gulf states have not seen one of this big of a magnitude in a very long time.
Through looking at reports from the 1963 snowstorm; it is evident that the “nor’easter” trend was underestimated and caused much chaos and challenged meteorologist forecasts for being outside of the “average” value sets.


