After four-consecutive “wins” at seasonal forecasting, last year’s Outlook was, in a word, not great. It felt like I missed nearly every place I tried to get right. Okay, it wasn’t that bad. I gave myself a C- grade. I did well on the precipitation, but air-balled the general temperature trend each month.
This year, I’m looking forward to rebounding. Getting back to nailing them all.
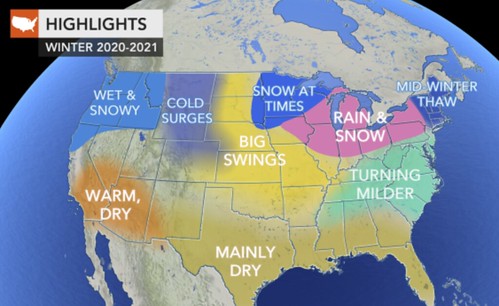
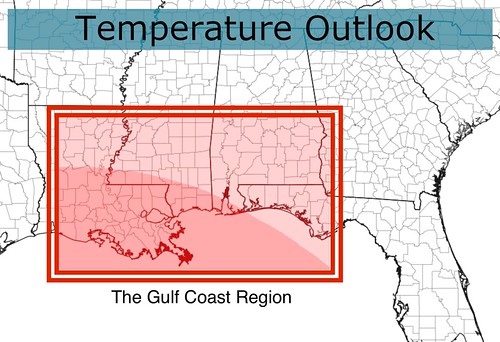
This Winter Outlook is for the Gulf Coast region highlighted on the map below.

The Preamble
I know, I know. Everyone has one of these things. And my forecast may differ from other forecasts offered by NOAA, The Weather Channel, WeatherNation, Accuweather, any number of Famrer’s Almanacs, and most of the “Super Duper Weather Alert Extreme Chaser Weather Meteorologists” facebook pages. I don’t know that it is better or worse than any of those, but it will likely be different, as I take a different approach than most places.
Unlike some of those places (and much like NOAA), I leave my Winter Outlooks up and available year round, so you can go back and check on how I did.
Accuweather
The Farmers Almanac
A different Farmers Almanac

The NOAA Climate Prediction Center
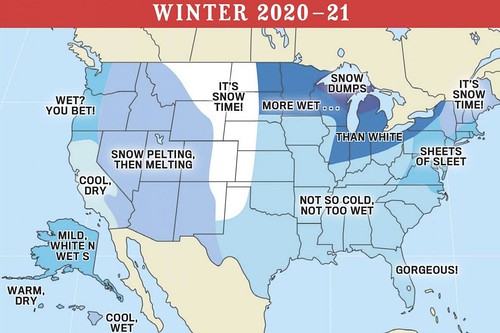
None of them give anything more than a broad brush of possible generalized conditions. What does “MORE WET…” even mean? And does “Equal Chance” mean there is as good of a chance that the area is warm AND cold?
The best question, though, is: How did these places even come up with these predictions?
They leave more questions than I have time to answer. Plus, I don’t even know how Accuweather or the Weather Channel come up with their forecasts since they are often proprietary secret formulas (like, say, TOR:CON) that no one else has access to see. The Climate Prediction Center explains their decision, somewhere, but I can’t track it down at this time.
The most frequent question asked of meteorologists is also the most important here: What about where I live?
Well, if you live in the box highlighted above, you’re in luck. This one’s for you.
A quick look at the analogs
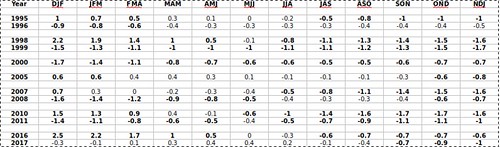
Looking all the way back to the 1950s, there have been 23 La Nina winters. When trying to come up with the winter forecast, I like to find La Nina winters that look the most like – as far as sea-surface temperature are concerned – the upcoming winter is forecast to look.
That should give a good approximation as to where to begin.
The analogs include:
1954 – 1955
1964 – 1965
1970 – 1971
1988 – 1989
1995 – 1996
1998 – 1999
2016 – 2017
This is a good repository to pull from. Recall a few years back, we only had a few similar years. So this should help to create a better Outlook. That said, due to climate change, comparing years back in the 50s and 60s can be problematic. That likely holds into the 1970s, too. Perhaps even into the 1980s. This may not be for the first reason that comes to your mind. Climate change has shifted a lot of things. Most importantly for the local weather, though, is how climate change has shifted how the Jet Stream works.
Research suggests that a warmer climate makes the Jet Stream move wavy north to south. Keeping that in mind, since 1990, There have been 10 La Nina winters.
Then, we can dig into the Pacific Decadal Oscillation, PDO, for those years to see how they compare to each other and how they compare to the potential for this upcoming winter.
What is the PDO? I’m so glad you asked:
The PDO for the analogous ENSO years looked like this:
1954 – 1955 = -0.31
1964 – 1965 = -3.59
1970 – 1971 = -6.01
1988 – 1989 = -3.39
1995 – 1996 = 3.29
1998 – 1999 = -5.99
2016 – 2017 = 0.60
And while the predictive skill of the PDO is reasonably low, we do know that right now, the numbers are trending more negative over the past few months as we head into winter. This is similar to the 1970-1071 and 1998-1999 winters. So we can use that as the “sprinkles on top” of the actual forecast. Since the PDO data isn’t enough to help us make a decision, we will simply add it to the final decision to give a bit more confidence to our decision.
The Outlook
Based on the ENSO analogs, the PDO data, as well as a some of the other variables I didn’t include here… The November to March Outlook:
Warmer and Slightly Drier than average.

Looking at the Outlook by Month:
November
Normal Averages
Low Temp – around 45
High Temp – around 70
Precip – around 4.25″
Outlook
Temperature: Slightly Warmer
Precipitation: Slightly Drier
December
Normal Averages
Low Temp – around 40
High Temp – around 65
Precip – around 5.00″
Outlook
Temperature: Warmer
Precipitation: Slightly Wetter
January
Normal Averages
Low Temp – around 35
High Temp – around 60
Precip – around 5.5″
Outlook
Temperature: Much Warmer
Precipitation: Wetter
February
Normal Averages
Low Temp – around 40
High Temp – around 65
Precip – around 5.5″
Outlook
Temperature: Slightly Warmer
Precipitation: Much Drier
March
Normal Averages
Low Temp – around 45
High Temp – around 75
Precip – around 5.5″
Outlook
Temperature: Cooler
Precipitation: Average
Caveats and Extra Tidbits
– While the forecast is for slightly wetter” and “wetter” conditions in DEcember and January, data doesn’t suggest extra precipitation days, just rather more precipitation when the precipitation falls.
– La Nina events since 2000 have featured at least one day with snowfall for the the Gulf Coast region – except the 2008-2009 winter.
– La Nina events since 2000 have featured days with lows below 20 degrees at least once
– Severe weather events are more likely – on average – during January and February for the Gulf Coast region during La Nina years
– A negative PDO shift means the Jet Stream may lead to more frequent shots of colder air this winter, despite the warmer outlook
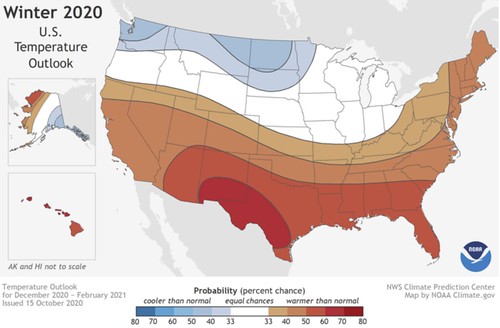
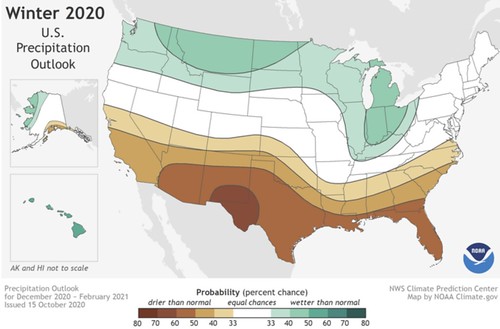
From NOAA
Getting back to NOAA, quickly. Here is the outlook from NOAA. You may notice that – locally – I disagree with some of their findings.


