A La Nina Advisory has been issued by the Climate Prediction Center. This is an indication that La Nina conditions have been observed and are forecast to continue.
Recall that a La Nina, in short, means cooler surface water off the coast of Peru.
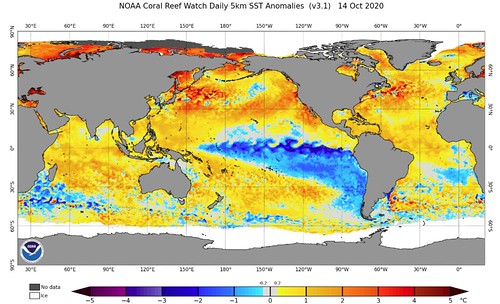
As you can see from the sea-surface temperature anomalies above, there is cooler water off the coast of Peru.
No, but like ‘What’ is a La Nina, really?
Right. It actually does have some hard numbers to it, it isn’t just some abstract ‘cooler’ or ‘warmer’ measurement. La Nina occurs when the sea-surface temperatures are lower than 0.5 degree below average. The atmosphere – globally! – responds to this change. The cooler water temperatures moves the jet stream to different areas and increases the chances that different weather to happen in different areas.
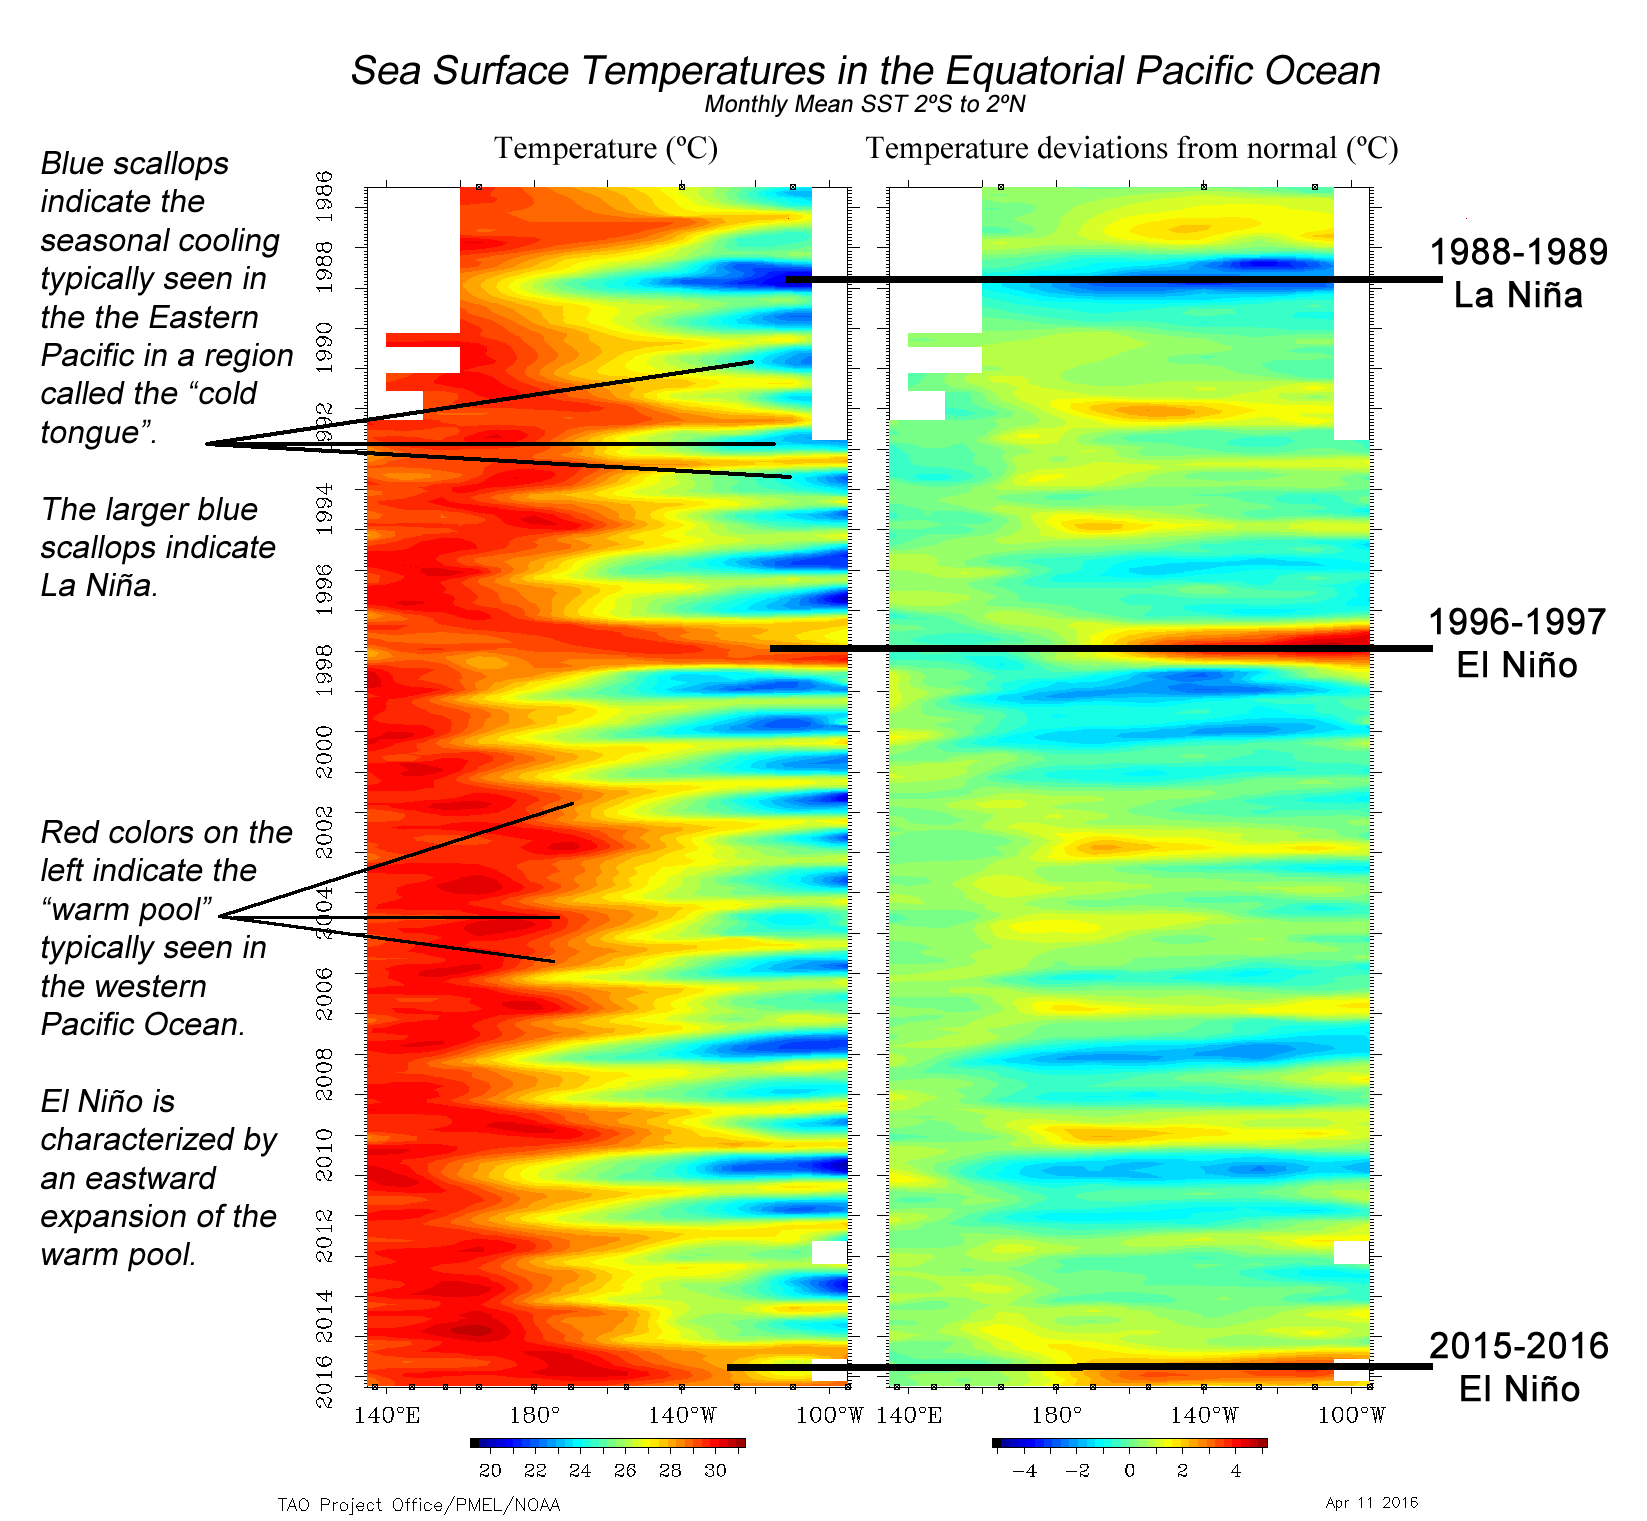
The textbook definition of La Nina from NOAA sounds like this:
La Niña is characterized by unusually cold ocean temperatures in the Equatorial Pacific, compared to El Niño, which is characterized by unusually warm ocean temperatures in the Equatorial Pacific. The graphic below shows the sea surface temperature in the equatorial Pacific (20ºN-20ºS, 100ºE-60ºW) from Indonesia on the left to central America on the right.
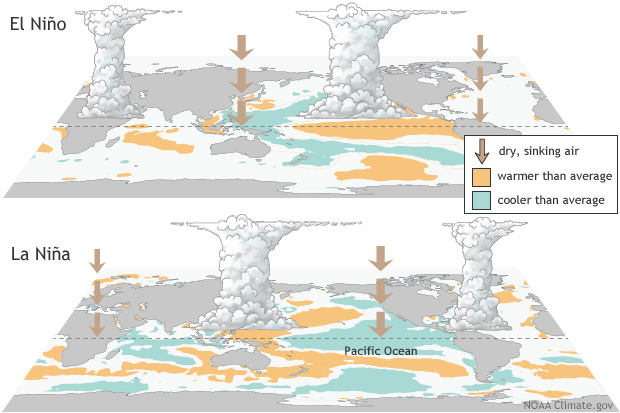
Historically, the ocean goes back and forth between El Nino and La Nina. That back-and-forth action is called ENSO by scientists. It stands for El Nino Southern Oscillation. Sometimes we are in an El Nino (more warmer water) and other times we are in a La Nina (more cooler water).
The reason one develops instead of the other is – quite – complicated so hang on tight, we are about to get nerdy…
ENSO is the result of the interaction between the surface layers of the ocean and the immediate atmosphere above it in the tropical Pacific. The internal dynamics of that relationship (the coupled ocean-atmosphere system) involving unstable air-sea interaction and planetary-scale oceanic waves determines which one, El Nino or La Nina, happen. Because the interaction is locally based, but results in global changes, forecasting the development or termination of either El Nino or La Nina is both very difficult and important.
The reason ENSO changes what the atmosphere does, and not the other way around is because this change in water temperature is not seasonally dependent. It isn’t like lake or river temperatures where it is cooler in the winter and warmer in the summer.
What is the forecast?
The forecast is that La Nina will persist this Fall of Winter. just like a few years ago.
From NOAA:
a Niña continued during September, as evidenced by below-average sea surface temperatures (SSTs) extending from the Date Line to the eastern Pacific Ocean. The SST indices in the two westernmost Nino regions, Nino-4 and Nino-3.4, cooled throughout the month, and the Nino-3.4 index was -1.1°C in the past week. The equatorial subsurface temperature anomalies (averaged from 180°-100°W) remained substantially unchanged, and continued to reflect below-average temperatures from the surface to 200m depth in the eastern Pacific Ocean [Fig. 4]. The atmospheric circulation anomalies over the tropical Pacific Ocean remained consistent with La Niña. Low-level wind anomalies were easterly across most of the tropical Pacific, and upper-level wind anomalies were westerly over the east-central Pacific. Tropical convection continued to be suppressed from the western Pacific to the Date Line, and a slight enhancement of convection emerged over Indonesia. Also, both the Southern Oscillation and Equatorial Southern Oscillation indices remained positive. Overall, the coupled ocean-atmosphere system indicates the continuation of La Niña.
A majority of the models in the IRI/CPC plume predict La Nina (Niño-3.4 index less than -0.5°C) to persist through the Northern Hemisphere winter 2020-21 and to weaken during the spring [Fig. 6]. The latest forecasts from several models, including the NCEP CFSv2, suggest the likelihood of a moderate or even strong La Nina (Niño-3.4 index values < -1.0°C) during the peak November-January season. The forecaster consensus supports that view in light of significant atmosphere-ocean coupling already in place. In summary, La Niña is likely to continue through the Northern Hemisphere winter 2020-21 (~85% chance) and into spring 2021 (~60% chance during February-April; click CPC/IRI consensus forecast for the chances in each 3-month period).
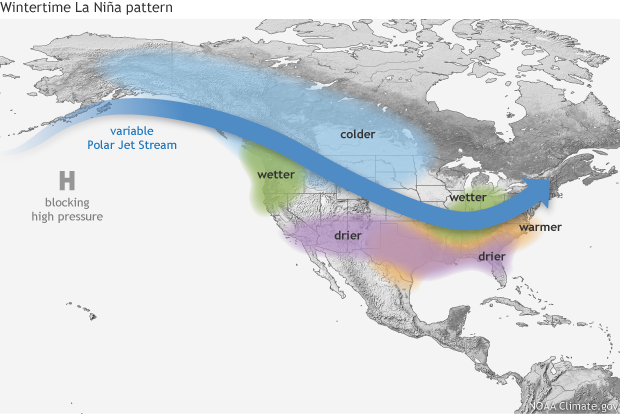
La Niña is anticipated to affect temperature and precipitation across the United States during the upcoming months.
Nick, what does that mean for me?
Generally a LA Nina promotes the development of severe weather across the Pine Belt. And southeast. We are generally warmer in the winter. And generally drier.
According to research by Mark Bove, “The Ohio River Valley and Deep South see a region of statistically significant increased tornadic activity during La Niña.”
The graphic to the left shows the difference between an . ENSO-neutral year (normal) and a LA Nina year (colder water). It is broken down by three-month intervals: (a) January-February-March, (b) February-March-April, (c) March-April-May, (d) April-May-June.
Notice the red blocks near us for (a), (b) but then those areas lift to our north by (c) and (d). So, despite the “generally drier than normal’ tendencies with La Nina, statistically, there is a section of the severe season that gives the Pine Belt more chances for storms, and thus, tornadoes.
That is between January and April.
Evidence for that is also supported by the historical precipitation data collected during La Nina years.

Holy moly! This sounds awful!
Well, keep in mind that just like hurricanes and tornadoes – every La Nina is different. Not every one is full of doom and gloom. The most recent La Nina winter, in 2017-2018, featured record-breaking snowfall and had a, relatively, benign severe weather season. The year before didn’t feature much of a winter and we were dodging severe weather almost weekly.
Seasonal outlooks aren’t often able to give an apples-to-apples comparison.
But knowing if a season features a La Nina or El Nino can be the start of figuring out – in general – what to expect from Mother Nature over the course of a few months.


