7/17/20 COVID Update: Brain damage possible, Hydroxychloroquine trial results, Math explains the peril
Author: Nick Lilja
|| Published: 7/17/2020 at 2:04am
There are probably very few of you out there that are “undecided” about the steps to take to mitigate the threat of COVID-19. Sadly, the politicalization of science and fact has consumed the ability to have an open discussion about how to best tackle the issues.
I’m not here to tell you how to feel or what to do. But I do hope that you know this is a safe place to get solid information, not tainted by politics. My only bias – and yes I am fully aware of my biases – is that I want people to be as informed (with as solid, credible, actual, real information and data as possible).
That is my only bias on this site. I am a lobbyist for self-education with real, actual data from the actual medical community.
New Numbers
The numbers in this update will be Mississippi-centric, so if you are here from out-of-state, you may want to skip down to the research section as this area may not apply to you.
Total
Five Days after/per day
Two weeks after/per day
Since this started (Mar 11)
40188
4.60
41.50
Since Shelter in place (apr 3)
38827
161.80
201.64
Since re-opening (apr 28)
33839
261.60
251.50
Since Memorial Day (May 25)
26450
354.00
312.71
Since BLM Marches (June 5-12)
23412
366.58
461.95
Perfect Weather (June 16)
19540
608.00
545.71
Independence day (Jul 4)
8897
744.4
635.5
The chart above is not the most intuitive, grab-and-go way to display data, but it shows some important information. This is the cases-per-day broken down into two time periods after certain events. These events are not “temporally significant” meaning they aren’t broken down by “two-week intervals” or anything (I post that below). But rather by major events on the calendar.
Notice that the numbers “per day” for the “five days after” each event and fro the “two-weeks after” each event continue to rise. This is looking at the specific time periods after the events in question.
The increase in teh number of cases per day for specific time periods can give us insight into how certain events may have played a role in increase or decreasing the numbers. Or if it perhaps, had no impact. The trouble with this chart is that some of these time periods overlap – especially since Memorial Day. That makes it difficult to use science and math to come to a specific conclusion.
More importantly, it means if anyone is stating that one of these events – Memorial Day, the BLM Marches, perfect weather – is specifically responsible for an increase in numbers than another event, the conclusion is not rooted in science or math – but in conjecture or preconception. It can be estimated that one is more likely than the other, but it is not a definite certainty.
Breaking things down into two-week increments may allow for a better analysis of the data.
Two week increments
Total Cases
Cases Per day
Total Deaths
Death rate
March 11 – 24
380
27.14
3
0.79%
March 25 – April 5
1630
116.43
62
3.80%
April 6 – 19
2774
198.14
118
4.25%
April 20 – May 3
3365
240.36
141
4.19%
May 4 – 17
3555
253.93
218
6.13%
May 18 – 31
4320
308.57
212
4.91%
June 1 – 14
4047
289.07
156
3.85%
June 15 – 28
7149
510.64
149
2.08%
June 29 – Jul 12
10116
722.57
192
1.90%
This chart shows two things very well. The exponential growth and the reduced death rate.
The exponential growth is highlighted by the numbers jumping quickly from 4047 during the first two weeks of June to 10116 during the first two weeks of July. That is a nearly 2.5x increase in under 30 days. Previously, it took about 45 days to see a 2.5x increase between early May and late June. And it took nearly 60 days to get from 1630 in late March to 4320 in late May .
In other words, we are shrinking the amount of time it takes to infect the next exponentially larger group of people.
The flip side of that is that the death rate is being reduced. More people are becoming sick and surviving. That is good. Not great. But good. I would rather have people alive than dead. But I would rather them not be sick than infected. So it isn’t great, but it is a move in the right direction.
The death rate got as high as 6.13% during May. It is back down to around 1.9% for the beginning of July.
There have been a lot of hypotheses that the virus is “losing strength” but there hasn’t been any studies or science to fully back that up yet. So it is still in the realm of hypothesis. Some papers show there may be two or three different strains, some causing more symptomatic illnesses. Other papers show certain strains may be more infectious than others. But no papers can highlight if the virus is “losing strength” yet. The lowered death rate may simply be a case of who is being infected and showing symptoms, not a reflection on the virus itself. That is still “To Be Determined” at this point.
And while the death rate is being reduced, in the grand scheme of things it is almost a wash because if we cut the death rate in half, but double the number of cases, we are still killing just as many people.
On to the research!
Masks work, here’s evidence
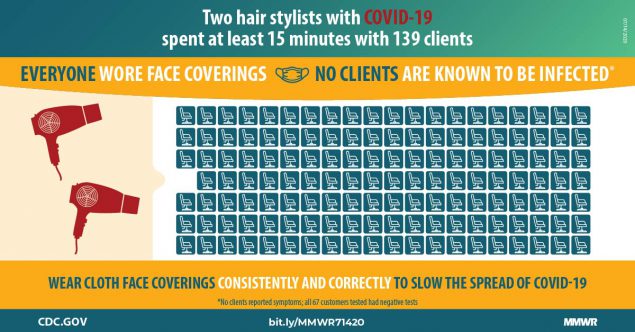
In a new paper titled “Absence of Apparent Transmission of SARS-CoV-2 from Two Stylists After Exposure at a Hair Salon with a Universal Face Covering Policy — Springfield, Missouri, May 2020”
Here is an excerpt:
On May 12, 2020 (day 0), a hair stylist at salon A in Springfield, Missouri (stylist A), developed respiratory symptoms and continued working with clients until day 8, when the stylist received a positive test result for SARS-CoV-2, the virus that causes coronavirus disease 2019 (COVID-19). A second hair stylist (stylist B), who had been exposed to stylist A, developed respiratory symptoms on May 15, 2020 (day 3), and worked with clients at salon A until day 8 before seeking testing for SARS-CoV-2, which returned a positive result on day 10.
A total of 139 clients were directly serviced by stylists A and B from the time they developed symptoms until they took leave from work. Stylists A and B and the 139 clients followed the City of Springfield ordinance* and salon A policy recommending the use of face coverings (i.e., surgical masks, N95 respirators,† or cloth face coverings) for both stylists and clients during their interactions.
Courtesy: cdc.gov
Other stylists at salon A who worked closely with stylists A and B were identified, quarantined, and monitored daily for 14 days after their last exposure to stylists A or B. None of these stylists reported COVID-19 symptoms. After stylist B received a positive test result on day 10, salon A closed for 3 days to disinfect frequently touched and contaminated areas. After public health contact tracings and 2 weeks of follow-up, no COVID-19 symptoms were identified among the 139 exposed clients or their secondary contacts.
The citywide ordinance and company policy might have played a role in preventing spread of SARS-CoV-2 during these exposures. These findings support the role of source control in preventing transmission and can inform the development of public health policy during the COVID-19 pandemic. As stay-at-home orders are lifted, professional and social interactions in the community will present more opportunities for spread of SARS-CoV-2. Broader implementation of masking policies could mitigate the spread of infection in the general population.
Incredible. Out of 139 people exposed to two people in close contact for an extended period of time, the masks worked at slowing the spread. And reduced the R0 value (transmission rate). Now, while the report shows that zero people reported symptoms, that doesn’t mean they weren’t infected. Overall, 67 of the clients volunteered to be tested, and 72 refused. Of the 67 tested, none of them were shown to be infected. And the 72 that refused testing never became symptomatic.
The median age of client was 52. And the average time in close contact was between 15 to 20 minutes.
So this is really encouraging and good news. If everyone buckles down and throws on a mask in public, we may be able to beat this thing.
Brain damage
In a new paper titled,”The emerging spectrum of COVID-19 neurology: clinical, radiological and laboratory findings” researchers looked at a small group of random individuals with COVID-19 symptoms that eventually displayed some sort of neurological complication.
Full disclosure here, I’m not a doctor and there are times when I cannot fully translate what researchers are saying into practical English. This is – sort of – one of those times. The authors wrote:
SARS-CoV-2 infection is associated with a wide spectrum of neurological syndromes affecting the whole neuraxis, including the cerebral vasculature and, in some cases, responding to immunotherapies. The high incidence of acute disseminated encephalomyelitis, particularly with haemorrhagic change, is striking. This complication was not related to the severity of the respiratory COVID-19 disease. Early recognition, investigation and management of COVID-19-related neurological disease is challenging. Further clinical, neuroradiological, biomarker and neuropathological studies are essential to determine the underlying pathobiological mechanisms, which will guide treatment. Longitudinal follow-up studies will be necessary to ascertain the long-term neurological and neuropsychological consequences of this pandemic.
The researchers found that – in some people – cognitive issues arose after infection with COVID-19. These researchers found inflammation of the brain led to many complications for the small group of people studied. And in some cases well after the most severe symptoms had subsided. That means that while people may be getting over COVID-19, their body may still be fighting the infection in a different way.
This finding ties directly into the CDC guidance that cites “Confusion” as a symptom. Even in those with no known neurological issues prior to infection.
The researchers noted that this type of complication deserves more study.
Why you lose your sense of smell
In a new paper – still waiting on peer review – titled, “Evidence of SARS-CoV2 entry protein ACE2 in the human nose and olfactory bulb” researchers tried to make a connection between how the virus enters the body with why some people lose their sense of taste and smell. The authors wrote:
Based on our findings we presume that SARS-CoV2 can enter the cells from the upper respiratory system via the viral entry proteins ACE2 and TMPRSS2. The infection of the sustentacular cells of the olfactory epithelium together with the underling Bowman’s gland cells may lead to altered mucus production, metabolism and structural instability in the olfactory epithelium. In addition, infection may result in the inability of the olfactory receptor neurons to connect to odorants via odorant binding proteins. Nevertheless, most patients regain their ability of smell perception, due to the fact that the basal cells are presumably not affected by the virus and can therefore replace destroyed cells of the olfactory epithelium.
This was actually a really interesting paper to read. It turns out that in some people, the way the virus gets into the body is through the nose. And it starts making copies and damaging the first system it gets to – the olfactory system.
This paper is still waiting on peer review, so it remains to be seen if the findings can be reproduced by others. But it was interesting to learn about how the interruption of the systems responsible for mucus production may, in turn, reduce the ability for the body to assimilate odor information.
Double-blind study finds hydroxychloroquine no effective
Another study on hydroxychloroquine completed recently. A paper titled, “Hydroxychloroquine in Nonhospitalized Adults With Early COVID-19” was just published in the Annals of Internal Medicine. This was a randomized, double-blind, placebo-controlled trial. This is the creme-de-la-creme of medical trials. This is how they actually figure out if medicine works or not.
Courtesy: Annals of Internal Medicine
And it turns out that there was not significant improvement in symptom relief with hydroxychloroquine. Sadly, it looks like the symptom improvements reported by hospital doctors earlier during the pandemic were skewed by other factors 9some of those have been previously discussed on this blog).
Getting back to the mathematics, explaining the trouble we are in
When the first “quarantine” steps began, most states were facing “active cases” numbers in the 500 to 2,000 range. Some had more, others less. As we learned, the idea was to keep people isolated and to keep them from interacting with others as much as possible to slow the spread. Because, at the time, it was found that the virus was spreading with an R0 value of 2 to 3, meaning each infected person could pass it along to two or three other people.
I talked about the exponential growth of COVID-19 back in mid-March. And how quickly this virus could move through a population. And, governmental leaders made decisions based on the science that if people were locked down at home, they couldn’t see anyone else to pass the virus along.
The problem is that most people didn’t abide by the mandate. So the virus continued to spread – albeit a bit slower – among the population. After slowly re-opening states and cities, there has been another explosion of cases in many spots.
A reminder that none of this is opinion. These are all facts.
The only way to slow the spread is to get the R0 value below 1. In other words, if I get sick and you get sick, only one of us passes it along to another person.
And the only way shown to be successful – so far – at reducing the R0 value is to shut down states or mandate – and enforcing – mask usage.
Again, and I really want to stress this, this is not my opinion. This is fact. And math.
And until that happens, numbers are going to continue to increase. And because we are moving along an exponential growth curve, the numbers will increase rapidly. In the beginning of June Mississippi was averaging around 150 to 350 cases per day. Now, in the middle of July it is close to 1,000.
How can that be? As each next person infects two or three other people, those new two or three others then infect two or three more. And so on.
The number of active cases is currently estimated to be around 15,000 people with nearly 20,000 still contagious. And without widespread mask usage or a shutdown, the R0 value is still above 1. Perhaps as high as two or three. And thus, those 15,000 to 20,000 people have the ability to infect more than one other person. Which pushes the numbers even higher.
Add to that the complication about super-spreaders.
So, it is not my opinion that numbers will continue to increase without more mask usage (full compliance) or another state quarantine. It is a mathematical inevitability.
This is why medical professionals suggest wearing a mask.
Author of the article:
Nick Lilja
Nick is former television meteorologist with stints in Amarillo and Hattiesburg. During his time in Hattiesburg, he was also an adjunct professor at the University of Southern Mississippi. He is a graduate of both Oregon State and Syracuse University that now calls Houston home. Now that he is retired from TV, he runs this site and its app in his spare time.
2 thoughts on “7/17/20 COVID Update: Brain damage possible, Hydroxychloroquine trial results, Math explains the peril”
Nick, your analysis of case growth in the first two tables/charts are not valid constructs. For the case growth to be relevant, perform the same calculations for tests reported over the same periods (multi-day periods and averages) and level-set that against the positive cases reported. It still won’t be a true correlation since tests from yesterday do not equal cases from yesterday do not equal deaths from yesterday. Just as your death rate is not a true correlation because those deaths are not necessarily aligned with cases reported during that same period. But, you will get a better sense of true case growth not indicative of increased testing.
You lacked scientific research on masks. Great article though.