For years, it was commonly believed that the Great Plains, a region stretching from Northern Texas to Iowa, was at greatest risk for tornadoes in the United States. The area even gained the reputation as “tornado alley.” However, beginning in the 1970s, many scientists began speculating a tornado maximum region in the southeastern United States. Dr. Timothy A. Coleman from the University of Alabama in Huntsville and Dr. P. Grady Dixon from Mississippi State University discuss in the 2013 study, An Objective Analysis of Tornado Risk in the United States, what region in the United States is most prone to tornadoes. The purpose of this study is to further our understanding of the regions with the greatest tornado risk in the United States by analyzing several key issues in an objective analysis.
Summary
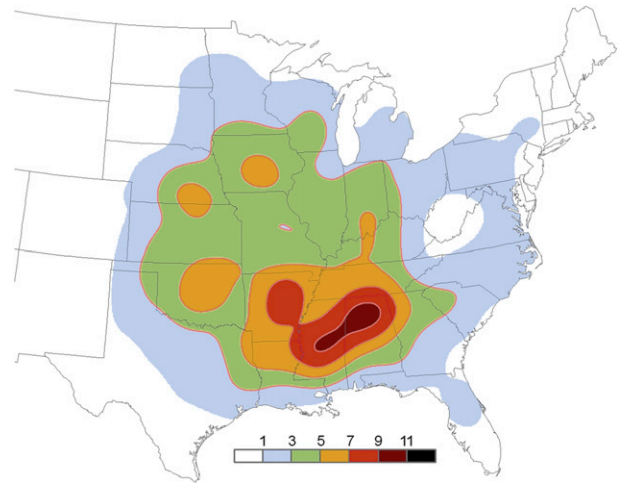
Data from the Storm Prediction Center suggests that tornado alley may be more of an “L” shape, including the Great Plains and extending eastward through Arkansas, Mississippi, and Alabama. Tornado datasets from 2003 to 2011 suggest that the southern part of the indicated region has the highest tornado risks, with a maximum over parts of Mississippi and Alabama. It has been suggested this data set may have been skewed from the tornado outbreak on April 27, 2011. However, data using only significant tornadoes from 1950 to 2004 indicates the region from Oklahoma to Alabama has the highest tornado risk.
There are several problems with tornado climatology which many studies fail to address. For one, the Fujita scale was not published until 1971, and it was not used to calculate tornado ratings in their near-immediate aftermath in the United States until 1973. Tornadoes before 1973 were rated in the Storm Prediction Center (SPC) database years after the fact. Newspapers and photographs likely overemphasized the damage, which led to higher ratings of some tornadoes prior to 1973. Furthermore, due to better tornado spotting techniques, National Weather Service warning verification procedures, and improved detection techniques, there has been a steady increase of annual reported tornadoes in the United States since 1973. This mostly led to an increase of reported weaktors (F0 or F1), while sigtor reports (F2 or greater) have remained relatively fixed since 1973. Another factor seen in results of previous research is the use of tornado days or number of tornadoes as the basis for their studies. The article believes that analyzing tornado pathlength is the most effective method of research, because it is more proportional to the area impacted.
The primary source used for this study is the SPC database. This database provides the date and time, location, intensity (Fujita or enhanced Fujita scale), pathlength, and other statistics on nearly every tornado in the United States from 1950-2011. This study uses data from 1973-2011, and only looks at storms above an F2 or EF2 rating or above. This is because the number of reported sigtors have remained steady over time. This eliminates most tropical-cyclone related tornadoes, which tend to be only EF0 or EF1. Maps of average annual tornado pathlengths were generated using kernel density estimation.
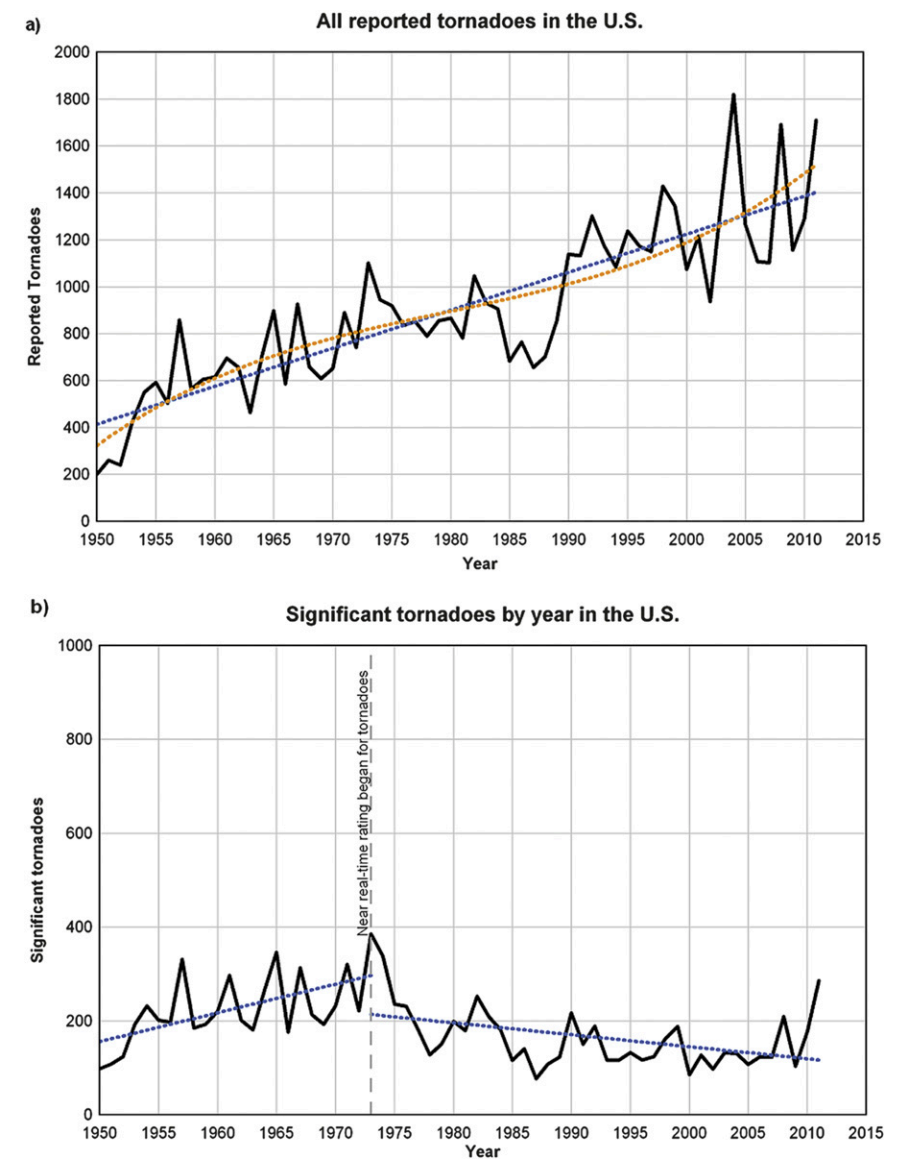
the beginning of the near-real-time rating of tornadoes, as opposed to after the fact rating.
The study notes in the southeastern United States, storm spotting is more difficult. The terrain is typically more rugged and covered with trees than the Great Plains. Additionally, a large percentage of southeastern United States tornadoes occur at night. It was determined using a sun zenith-angle algorithm, it was calculated that between 1973 and 2011, 48.6% of all southeastern U.S. tornadoes occurred at night. This number is reduced to 39.3% in the Great Plains. Using the SPC database, it was calculated that the average path area for sigtors was 19 times as large as weaktors. This means sigtors are much more likely to be reported.
The study concludes that the region with the greatest risk of tornadoes in the United States is a roughly east-west oriented area, from Central Oklahoma, through Arkansas and northern Louisiana, western and middle Tennessee, most of Mississippi, and northern and central Alabama. This research helps meteorologists by discussing the lack of practicality of using tornado days over pathways. For instance, this metric would allow for a day with an EF0 tornado hold the same weight as a day with 25 tornadoes. Furthermore, it gives an explanation for the increase of tornadoes reported since 1973, which may otherwise be attributed to other factors in climatology. The study clarifies the factors which cause flaw in scientific calculations, adding precision to speculation tornado alley extends to the southeastern United States. Finally, the report clears up misconceptions about the strength and damage of tornadoes in the Great Plains, clarifying to meteorologists the region with the highest concentrated tornado risk is northern and central Alabama and Mississippi. This conclusion will help in the future with data collection and public reputation of tornadoes in the United States.
Further study
There are three things I would further like to explore after reading this study. For one, it would have been nice to have seen the city they rated with the highest tornado risk in the United States (I live in Huntsville, Alabama, even though it’s somewhat of a dubious honor). I would also like to know what the region considered “tornado alley” would look like from using 1950-1972 SPC data. This could be used as a comparison to show if there is a perception change and to analyze how skewed past data is. Finally, it would be interesting to see if atmospheric teleconnections have had any impact on the region tornadoes hit, and if there are periods within the past 45 years that have seen more tornado risk in the Great Plains than in the southeastern United States.
Thank you for reading!
Work Cited
Coleman, T.A. and P.G. Dixon, 2014: An Objective Analysis of Tornado Risk in the United States. Wea. Forecasting, 29, 366–376, https://doi.org/10.1175/WAF-D-13-00057.1


