As part of the new trend, I have another article review up and ready! I really enjoyed this article! “Radar Climatology of Tornadic and Nontornadic Vortices in High-Shear, Low-CAPE Environments in the Mid-Atlantic and Southeastern United States” written by Jason M. Davis and Matthew D. Parker, this article gives great insight to the flaws within modern radar detection as well as solves some of the struggles with getting equal and consistent data for research. Here’s what I understood about this study in a brief summary, some key points that I believe could lead into additional study, and the charge that’s given to present day meteorologists in current studies.
Summary:
These gentlemen introduce the audience to their study by providing vital definitions and necessary background into the high-shear, low-CAPE scenarios that are to be addressed throughout the article. I greatly appreciated this point considering that I’m still new in terms of weather study and having these provided for me was so helpful in my understanding of the material covered. They outline the motive for examining the tornado warning system was due to the southeastern region of the CONUS having a higher likelihood for having tornadoes in the cooler seasons as well as at night as opposed to the remainder of the United States who mostly receive there’s in the warmer periods and during the afternoon.
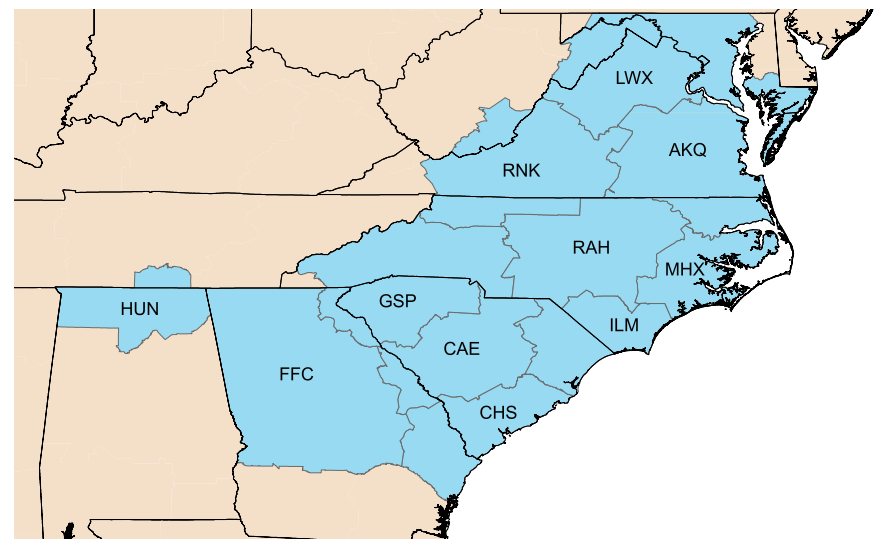
They saw a problem in the warning systems in place because criteria was set up for different parameters and therefore, fewer warnings were expected in unexpected times which resulted in higher population vulnerability. Thus, their research began in hopes of initiating a helpful update to a previously faulty system. The authors received outside feedback and collaboration from the National Weather Services in the southeast as well as other Weather Offices from Virginia to Georgia.
The collaborative efforts were involved in the selection of data and the filtering of tornado examples in order to get the most complete and fair data. Readers are introduced to their use of azimuthal shear in the study and how important this was in classifying the data by height and diameter. The article quickly moves into the results and while they outline very detailed the findings of the tornado warning in comparison to azimuthal shear for both tornadic and nontornadic vortices. They outline some very interesting data in regards to tornado warning lead time and lifespan of the storm.
Their findings suggest that the median time for detection was 14.6 minutes (NWS is 15 minutes). Sadly, a great deal of the research gathered was found to be incomplete or invalid due to radar functionality. For those who aren’t aware of the conflict with radar; radar beams travel in a straight line. When placed in combination of the curvature of the earth, it’s easy to understand that as the straight beam moves away from radar, it doesn’t follow the ground level. Thus, the further out you move from the radar tower, the higher up in the atmosphere the beam will hit. Davis and Parker acknowledge this by commenting that, “It is possible that this increase in azimuthal shear with range may be due to the fact that the beam height increases with range.
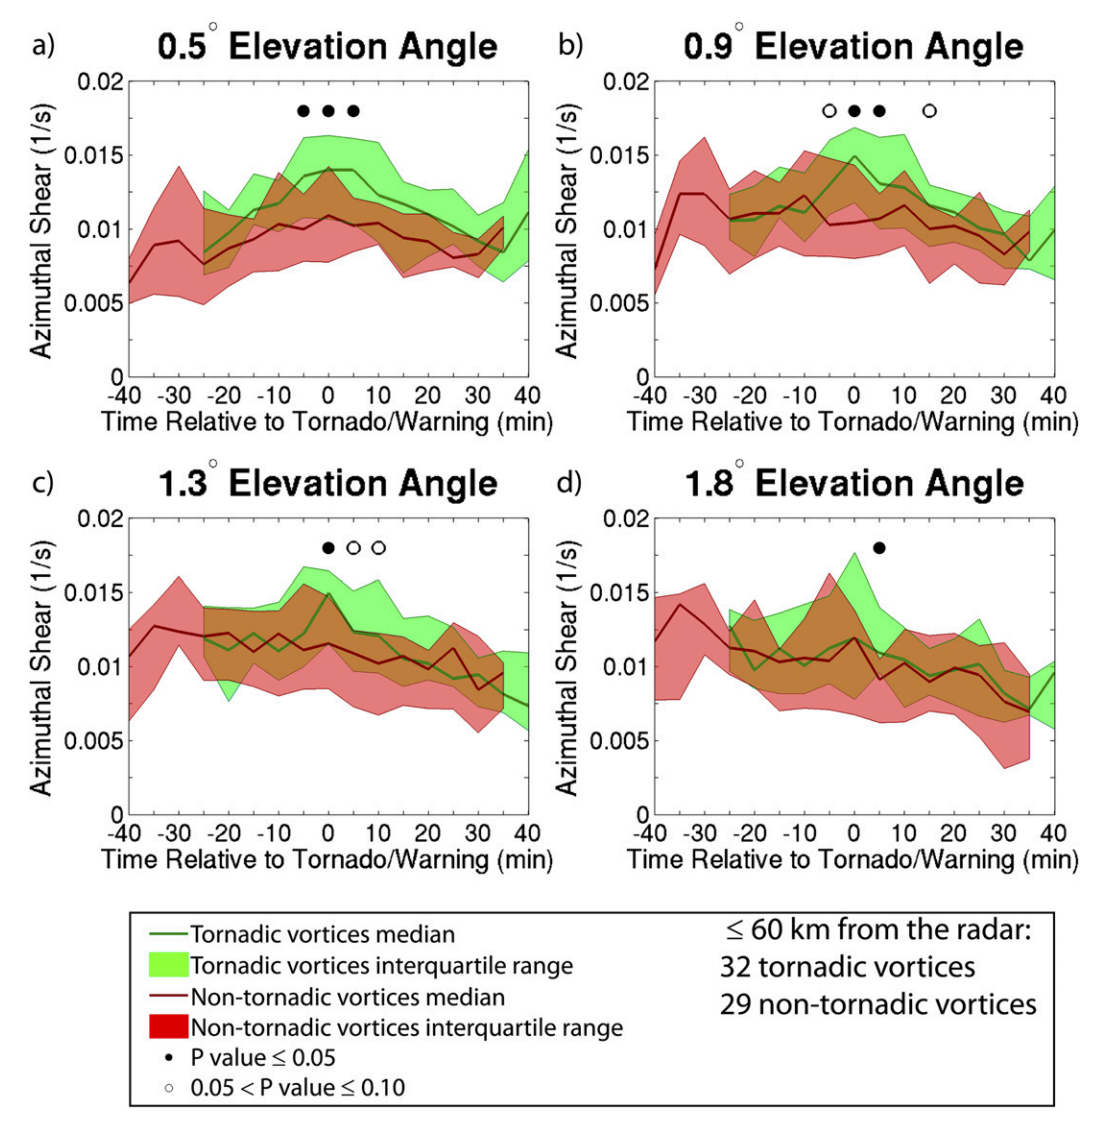
Perhaps these nontornadic vortices had strong rotation aloft but not at low levels,” (838-840). Additionally, in their results section, they explain how data is inconclusive due to having data at varied heights in the atmosphere. They rightly believe that tornado data found at different heights doesn’t accurately look at tornado warning due to the fact that much of their data couldn’t show what was actually occurring on the ground. While the atmosphere may show churning in the upper levels, there isn’t always action on the ground and thus, they can’t confidently look at the warnings in relation to what’s taking action.
They also explain the reasoning for not having any distinguishing factors between tornadic or nontornadic vortices as being due to, “First, the increase in effective beamwidth degrades resolution, and, second, the increase in beam height means that different parts of storms are sampled at different ranges,” (847). In conclusion of their article, Davis and Parker suggest many techniques that should be utilized in further studies of this topic. They address how newer approaches should tackle radar challenges differently to get more conclusive results and how, if successful, this would impact modern day meteorologists.
3 Things for Further Study:
- “While an azimuthal shear threshold of .006s^-1 can provide a moderate amount of lead time in many cases, issuing warnings based on this threshold would lead to copious false alarms. Earlier in this section, an azimuthal shear value of .01s^-1 was found to be a good threshold for retaining 75% of the tornadic vortices and removing 50% of the nontornadic vortices,” (837)
~ I would like to see how they could see improvement for increasing these percentages. To me, only catching 75% of the tornadoes still seems to overlooking a lot of other ones. It seems like there could be a way to catch more of them. I would really appreciate another study or at least some further discussion done to see how these values could be improved. - “For supercells greater than 100km from the radar, the effects of radar-sampling limitations became very apparent. Only 36% of tornadic supercells had hook echoes and BWERs/WERs, likely due to the effects of beam filling and the increase in height of the radar beam. These limitations have pronounced consequences for minisupercells,” (843).
~ This would be a great opportunity for another research project! This one would require more depth into the radar spectrum due to the fact that you either have to put more radar on the ground or the satellite radar technology has to get more advanced at a faster pace. I would like to see how the problems with radar could be fixed. Many projects have addressed radar problems affecting their research and I just can’t understand how this is actually still a problem in the twenty-first century. - “However, there likely is an unknown number of nontornadic broken-S signatures not associated with a tornado warning, and therefore the null broken-S dataset is incomplete. Lead time associated with the broken-S line break varied. . .This suggests that the broken-S signature has limited utility for issuing tornado warnings prior to tornado formation at this range,” (845).
~This portion gave me a wondering about how further studies could overcome the data set being nullified. Is this a problem that future studies will deal with because the data is simply to inconsistent or vague? I would like to see how this could be overcome and if there’s a separate study that could configure a new calculation for us to use in collecting broken-S data to provide null comparison of our research findings.
Modern Day Meteorologists:
Davis and Parker do a great job of giving a charge to other meteorologists in future endeavors. They include a great deal of insight into what went wrong with their study and how these problems could be overcome. They state, “Because this study uses a new method, future work should explore the wider application of these results to higher-CAPE environments. Idealized sensitivity tests and real-data modeling simulations would also improve our understanding of the dynamics of HSLC minisupercells and QLCS mesovertices. One could place a simulated radar into such simulations to more definitively determine how radar sampling limitations affect the radar depiction of an HSLC storm, and also what particular kinematic and dynamic processes are associated with commonly observed radar ‘fingerprints’,” (851). Throughout the whole article, any time they found a lapse in their data, Davis and Parker were not afraid to mention incomplete information and then include what they suggest the solution to that problem is based on their experience. I believe this will help other scientists today see how not all tornado systems respond the same way and can’t always be seen on one warning program. Some regions of the United States don’t see tornadoes develop in the “ideal conditions” and therefore, their tornadoes are giving due justice when issuing warnings. This article gives a new look at how warnings should be given fair consideration based on the variables that are unique to each region and their specific value needs.
Works Cited
You can find the paper here: https://journals.ametsoc.org/doi/pdf/10.1175/WAF-D-13-00127.1
Thanks for reading ya’ll! See you tomorrow with my fellow interns to bring you a look at the updated forecast for the week and check back here on Friday for my next article review! Have a good night!


