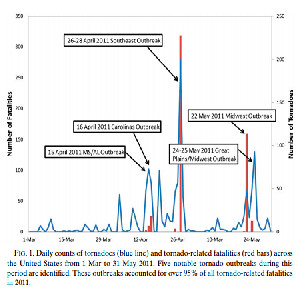
With nearly 1700 tornadoes confirmed, 2011 was one of the most prolific years for tornadoes in the United States. This ranked the second highest annual total since 1950. Also, with 553 casualties, it was the deadliest tornado year since 1936. The majority of these fatalities occurred during outbreaks, a group of tornadoes associated with a single synoptic-scale weather system. Outbreaks involve multiple tornadoes, some violent with long tracks. Because of this, they are more likely to impact populated areas, increasing the number of fatalities. Between 1875 and 2003, over 80% of tornado-related casualties occurred on tornado outbreak days. The 2014 study Ranking of Tornado Outbreaks across the United States and Their Climatological Characteristics develops a straightforward metric to assess the physical strength of tornado outbreaks across the United States.
Summary
The study constructed outbreaks using the Storm Prediction Center’s individual tornado reports from 1973-2010. As a control, only storms east of the Rocky Mountains were selected. Outbreaks were defined as a sequence of 6 or more tornadoes with an F/EF rating of 1 or greater with no more than a 6 hour period between consecutive tornadoes. The study developed two metrics for the strength of the tornado outbreak: 1) the estimated pressure exerted by the median wind speed multiplied by the pathlength of the tornado (hectopascal miles), and 2) F/EF-scale ratings multiplied by pathlength (Fujita miles). Hectopascal and Fujita miles were summed across tornadoes in each outbreak to find an estimate of its strength. To minimize potential geographical reporting biases, tornadoes were sampled from 18 states.
 A total of 846 tornado outbreaks occurred across the eastern United States from 1937-2010. These outbreaks accounted for more than half of tornadoes rated F/EF1 or greater, 83% of all violent tornadoes (F/EF4-F/EF5) and 79% of all tornado related fatalities. The outbreaks ranged from 0.8 adjusted Fujita miles to 7000 adjusted Fujita miles. More than half of outbreaks had fewer than 100 adjusted Fujita miles, and more than 90% of outbreaks had fewer than 500 adjusted Fujita miles. The two strongest outbreaks were the April 1974 Super Outbreak and the April 2011 outbreak. Stronger outbreaks generally exhibited the longest duration.
The mean duration of all outbreaks was less than 24 hours. The bottom 90% of outbreaks typically lasted less than 12 hours.
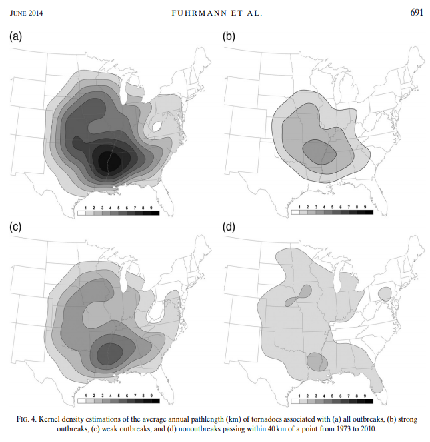
In contrast, the top three tornado outbreaks exhibited a mean duration of over 40 hours. Despite only accounting for 1.5% of tornadoes, the top three outbreaks were responsible for 15% of all tornado related fatalities. Outbreak risk covers a broad area across the Great Plains, Midwest, and Southeast. The region with the greatest risk for a tornado outbreak is centered on the Mississippi River valley and extends from near Little Rock, Arkansas, to Jackson, Mississippi, and south towards Monroe, Louisiana.
The mean frequency of weak outbreak tornadoes peak in mid-May, with a smaller, secondary peak in mid-November. Strong tornado outbreaks have a broader peak between March and mid-May, with a secondary peak in November. In contrast, nonoutbreak tornadoes peak in mid-June, and occur more frequently than outbreak tornadoes from July-October. The peak for strong outbreak tornadoes in the Southeast is in early April. The mean frequency of outbreak tornadoes in the Southeast remains above zero throughout the year, while approaching or reaching zero during the winter across the other four regions.
 Meteorologists may utilize this study to research and rank future tornado outbreaks in the United States. A ranking scheme based on Fujita miles may be useful to forecasters as a guidance for categorizing the threat level for tornadoes. This study concluded the vast majority of tornado fatalities occurred with outbreaks (approximately 80%), which may help with predicting and emphasizing a tornado’s threat to human life to a public audience.
Combined with results of previous work, this study suggests the Deep South is at greatest risk from strong, long-track, killer tornadoes, and these tornadoes are likely to occur in outbreaks. This research also paves the way for future research, possibly using data from F2 and greater tornadoes to identify relationships between outbreak strength and climate variability.
Further Research
There are three things I wish this study could have researched. First, in-depth comparative analysis could have made between tornado outbreak regions and tornado risk regions. The highest risk region for tornadoes in the United States extends from Mississippi to northern Alabama, but the highest risk for tornado outbreaks is centered more eastward. Which leads to another possible research question, what predisposes an area to a tornado outbreak as opposed to nonoutbreak tornadoes? Finally, what atmospheric conditions and climatological factors caused the 1974 Super Outbreak and 2011 Outbreak to be so severe? Is it possible to use those factors to predict future outbreaks?
Work Cited
Fuhrmann, C.M., C.E. Konrad, M.M. Kovach, J.T. McLeod, W.G. Schmitz, and P.G. Dixon, 2014: Ranking of Tornado Outbreaks across the United States and Their Climatological Characteristics. Wea. Forecasting, 29, 684–701, https://doi.org/10.1175/WAF-D-13-00128.1


