Hello all! With June being the start of the official first month of the Atlantic hurricane season (June 1st- Nov. 30th), and the second month of the eastern Pacific hurricane season (May 15th – Nov 30th), it’s time to get a first glimpse of what is currently going on in the tropics. We will look at how the region will progress over the next week or so. First, a start with a look at what is currently going on in the tropics from the NHC, a breakdown of the conditions, and then ending with model prognosis.
NHC Eastern Pacific Activity


Current Tropical Conditions
The easiest place to start is to highlight the current features that are present on the mid-level water vapor map of the tropical Atlantic and eastern Pacific from the College of DuPage. This will help to pick out atmospheric features that can be tracked and examined.

Looking towards the Gulf coast, mid level dry air is currently wrapping around the subtropical ridge that is centered over the southeast US, and there are also three main areas of interest across the rest of the tropics. The three disturbances will continue to propagate towards the west / north west, following the easterlies in the tropics. Disturbance number 3 is most notable, which at the time of writing this is tropical depression Celia. As you can observe with Celia, the system remains disorganized with pockets of moisture scattered away from the center.


Over the tropical Atlantic at 500MB, areas of ridging (blue H’s) over the southeast US and over the tropical Atlantic are steering any tropical moisture along with the easterlies and preventing anything from impacting the Gulf Coast. The two areas of ridging are also enhancing the easterly trade winds, as is indicated with stronger wind speeds in the Caribbean as compared to closer to the coast of Africa. These enhanced trade winds will also influence the magnitude of the wind shear currently over much of the Tropical Atlantic shown below.

This graphic shows the wind shear from 250MB-850MB. Wind shear is a value that describes how the wind changes with height and this graphic shows the large values currently centered over much of the tropical Atlantic with values above 50kts!. With strong wind shear, and systems have a hard time forming and developing as the stronger upper-level winds prevent a stable vertical structure. Looking at the eastern Pacific, tropical depression Celia is expected to move into an area of higher shear, towards the north west, which at first will limit intensification of the system.
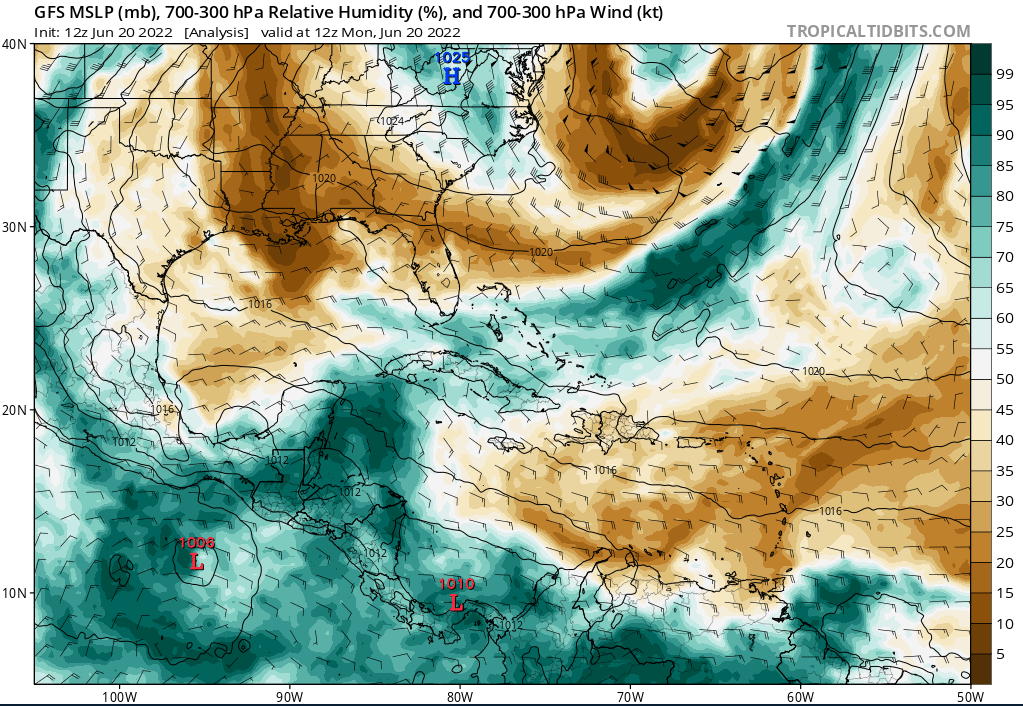

The relative humidity also reveals another limiting factor for tropical development, the absence of sufficient moisture for tropical systems. Throughout much of the Atlantic extending from the coast of Africa to portions of the Caribbean, dry air is intruding, limiting convective development. Where there is current activity over the eastern Pacific, there is sufficient moisture to support the continued development and deepening of tropical depression Celia, with deep moisture beginning to warp around the western side of tropical system. The subtropical ridge over the Gulf States is also streaming in dry air from the east.

Current 850MB heights and vorticity signal the lack of substantial organized activity currently over the region. One area of interest is an area of low pressure which was previously identified as tropical depression Celia, which is located just to the south of Mexico and Guatemala. The system appears to have a relatively small structure, with the most significant wind speeds close to the center and quickly diminishing as you progress outwards.
Model Prognosis:
Looking forward through the next 4 to 7 days, the GFS and the Euro provide different results across the tropical Atlantic.


Both models show the subtropical ridge currently across the southeastern US weakening and subsequently lowering upper-level steering flow. However, the GFS (right) shows a closed upper-level low pressure system off of the coast of South Carolina, while the Euro (left) shows a much more elongated trough dipping down into the Atlantic with activity further to the north.


The two models also slightly disagree on the shear present throughout some of the tropics. The Euro (left) model shows much stronger shear throughout a larger portion of the Atlantic, while the GFS shows slightly weaker shear. This would mean storms would be less likely to form given the Euro model as compared to the GFS.


Moisture availability for systems to “tap” into is expected to remain mainly dry with small sections of more available moisture. The Euro (left) shows dry air streaming in from the tropical Atlantic and Africa with the Gulf also remaining dry. The GFS (right) tells a similar story, with slightly less dry air intrusion from Africa and pockets of moisture near Puerto Rico and across the Lesser Antilles.


Due to the limiting factors with the moisture and wind shear, both the Euro and GFS do agree on little to no substantial tropical activity present over the next 6 to 7 days. The 850MB heights and vorticity maps show no substantial tropical systems throughout the tropical Atlantic.
Conclusions
With the substantial limiting factors of the dry air intrusion and high values of wind shear, any significant tropical development is not expected over the next 7 days or so with current model prognoses. Given the blocking pattern currently over the Gulf States, despite the above average sea surface temperatures in the Gulf of Mexico, the rest of the ingredients for tropical systems to develop is not present. Now it is early in the season and climatology reveals the height of hurricane season in the Atlantic basin to be in September, so this is only the beginning of the season ahead of us. The NHC is predicting a 65% chance of an above average hurricane season, so only time will tell how the rest of the season pans out!


