The problem with living in south Mississippi is that feels like severe weather is possible every time a front moves though.
The bigger problem? It doesn’t just feel that way, it is that way.
As an aside, this is not going to talk about the timeline of events, specific threat levels, or where specific storms will be. This is more a discussion about the overall threat for the region and the certainties that we can pull from the model guidance.
The Storm Prediction Center has outlined the area with a risk for severe weather on Thursday.
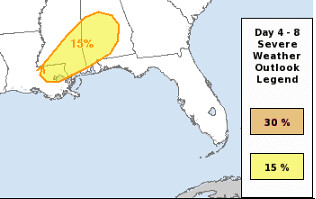
The 15% area equates to a “Slight” risk for severe weather. This will occur as a cold front pushes through the area.
From the SPC:
“Model consensus is that a broad synoptic upper trough will dominate much of the U.S. on Thursday (day 4). A shortwave trough embedded within this feature will deamplify as it moves rapidly from the lower MS Valley early day 4 to the northeast U.S. by day 5. Storms will be ongoing along cold front from the TN Valley to LA early in the day. Wind and vertical shear profiles enhanced by the ejecting shortwave trough will be supportive of severe storms. While lapse rates will remain poor, influx of low-level moisture will result in at least marginal instability, and storms may organize along the cold front posing a risk for mainly damaging wind along with a conditional threat of a couple of tornadoes over a portion of the Gulf Coast states.”
The good news? At this time, computer weather model guidance suggests this round doesn’t look terribly severe.
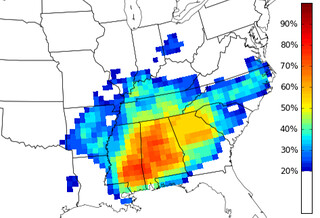
The CIPS Analogs out of Saint Louis University appears to show a pretty robust severe weather threat possible – if all you do is look at the map for “at least one severe weather report within 110km of a grid point” and move on.
But, if you get into the maps a bit deeper, you’ll find that the map shown may be a bit over-done due to a few very severe events. And because this isn’t anticipated to be a very severe event, we tend to disregard the over-the-top ones.
Take a look at the Top 15 Analogs analog table. This is an image with all of the severe weather reports for each event that is similar to the upcoming event.

The PPF, or Practically Perfect Forecast, simply means that based on the reports the weather service received during the event, what should the Storm Prediction Center Risk area looked like.
Notice that there are a few very big events on here. The top three most severe:
5 – February 10, 1990
12 – March 3, 2012
14 – April 4, 1989
Based on the PPF, these events could have been given as high as a “Moderate Risk” when looking back.
But outside of those three, the only events that produces severe weather
1 – February 15, 1992
7 – March 13, 1988
10 – February 22, 1997
15 – February 18, 2008
These days could have been categorized as a “Marginal” or “Slight” risk days.
Stepping back, that means that 7 of the top 15 analogs produced at least one severe weather report. Three of those seven produce widespread severe weather reports.
So let’s dig into the data further…
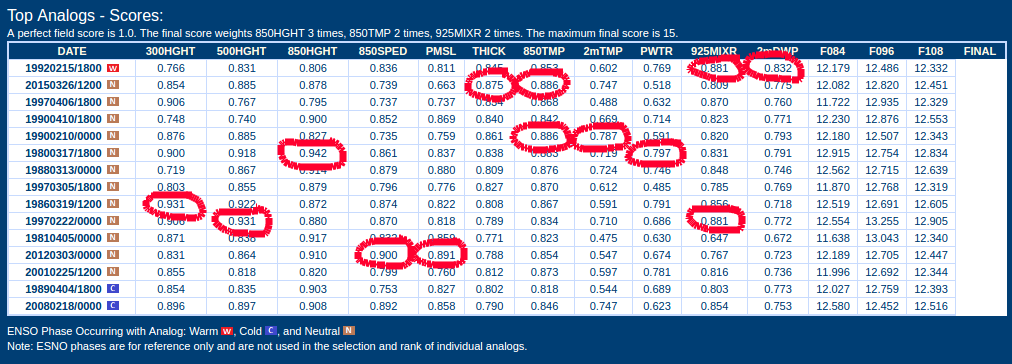
Here is the data-only analog table. The quick way to read this is that each of the Top 15 most similar severe weather events are listed top to bottom on the left side. Then each parameter that goes into the CIPS is listed along the top. So each row is an event, and each column is a parameter.
Line ’em and you see how close that event is to the current event. For example, the 19920215/1800 event (also known as the February 15, 1992 event) “300HGHT” (also known as the 300mb height measurement) is 0.766. That means it is a 76.6% match to the current forecast for our next event.
Not a very good match.
But the 9th-most-similar event (the ninth one down on the list) is 0.931. Or a 93.1% match.
I’ve put a red circle around each column’s highest number. That corresponds to one of the Top 15 most similar events.
Since we are looking for the one that most closely resembles our upcoming forecast, we run the calculations and end up with numbers 6, 7, and 10 as the ones that most closely resemble our upcoming forecast.
6 – March 7, 1980
7 – March 13, 1988
10 – February 22, 1997
Two of those, 7 and 10, produced severe weather for our area. Neither produced significant severe weather.
That is one reason that – while we are outlines for a “Slight” risk, that I am a bit hesitant to ‘sound the alarm’ so to speak about a bigger threat. Rain? Absolutely. Wind damage? Probably, but not catastrophic. Hail? Perhaps. Tornadoes? Can’t be ruled out.
While things may change, the forecast guidance as of now doesn’t support the threat for anything like Alabama saw last week. More details on specifics of this forecast to come – later tonight and tomorrow.


