Yeah, you read that correctly. It is roughly the same pattern today as what brought all the snow to South Mississippi two years ago – almost to the day. So why no snow this time? I’ll explain… But first! Let’s go back in time!

A lot of snow fell from the sky that day.


We were expecting up to 3 inches in some spots with – in general – about 1.5 inches of snow across the region. But we easily passed that by 8am in some places.
The setup was a SW flow aloft over the top of some much colder air. For a full recap, check out this write up where I talk about what we learned about forecasting snowfall from that event.
Why isn’t it snowing this time?
The obvious answer is the correct one: It isn’t cold enough. Okay, sure. But it is much more textured and multi-layered, too. Because the same general pattern is established today as it was in 2017. With a few exceptions.
For example, look at this 500mb chart from 2017:
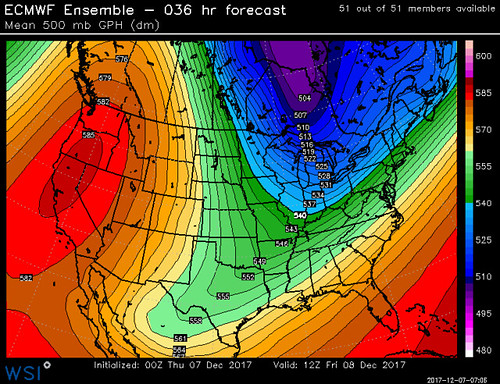
Now look at today’s 500mb map:

Pretty similar. But not completely identical. The ridge of high pressure in the west isn’t as pronounced this go-around, meaning the recoil of colder air diving south isn’t as robust. And therefore the coldest air isn’t pushed south. And the ridge of high pressure in the Atlantic is a bit stronger, meaning the cold front moving south toward the Gulf of Mexico isn’t moving as quickly.
What does all of that mean?
Well, a slower moving front, with less cold air behind it means that the “cold Canadian air” we always talk about modifies more before it moves all the way south toward the Gulf.
You can think of it like carrying a cup of coffee from the coffee pot to your desk at work. If the coffee isn’t as hot to begin with and you walk slower, the coffee won’t be as hot by the time you get to your desk and drink it. But! If it was scalding hot when you poured it into your cup and you ran back to your desk, it may still be pretty hot when you get there.
Same rule applies to cold air. The slower it moves and the warmer it is when it starts, the warmer it will be when it gets here.
Take a look at the Skew-T from two years ago:
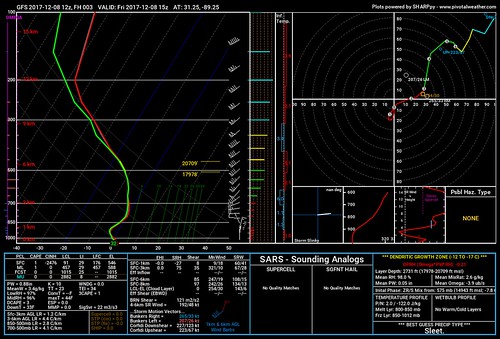
Now take a look at the Skew-T from today’s data:

For a flip-flop comparison:
Without having to dig too deep into understanding the chart, just know that the farther to the right the red and green lines are the warmer the atmosphere is, and the farther left, the cooler it is.
In fact, the coolest part is that the atmosphere will be making snowflakes as the precipitation comes to an end, it just won’t be cool enough at the surface for those snowflakes to make it all the way to the ground without melting.
And this is why it is so difficult to predict snowfall in the South. There are a lot of things that can look the same from potential snowfall event to potential snowfall event.
But where snow happens versus where it doesn’t happen can sometimes be found in the tiniest details that eventually broaden out into the biggest reasons.
Neat stuff!


