A lot of times during Hurricane Season a lot of the buzz is around the model data. Social media is plastered with images of operational model output, spaghetti models and intensity guidance. But once a tropical system forms, the best place to get the most accurate forecast information is from the National Hurricane Center.
The NHC is full of fantastic meteorologists who work around the clock to take all of that raw model data and turn it into a straight-forward and understandable forecast.
A good analogy would be, would you rather eat a raw steak or one properly seasoned and grilled? I’m going to guess you’d rather it be cooked.

And that is what the NHC does! It turns that great piece of steak into a well-grilled masterpiece.
TROPICAL SYSTEMS WOBBLE
The atmosphere is a turbulent place and tropical systems don’t move in a straight line. And a lot of the puzzle pieces in the atmosphere tend to nudge tropical systems while they move along their path. Unlike mid-latitude cyclones which travel along the jet stream, tropical systems just bounce between ridges of high pressure.

Tropical Storm Ida in 2021 is a great example of this. The system was going to interact with a ridge of high pressure to the northeast and the mid-level area of low pressure to the northwest. the purple arrows in the image above are the general “flow” of the atmosphere.
And the purple arrows are where the tropical system are going to go, like wind blowing a leaf floating on a water puddle. And the path is often wobbling back and forth along the way because any wiggle from any of the pieces of the puzzle will wobble the system.
So when you see model data showing a straight line, now only is the forecast you get from the model incomplete, but it is also not accurate.

While it is fun to look at the models, when making a decision about “Do I need to take action?” the forecast cone is better!
THE FORECAST CONE
Some people call this the “Cone of Uncertainty” but I prefer calling it the Forecast Cone. I don’t know if the name matter much, but I tend to think too many people get caught up on the word “uncertainty” and think that meteorologists don’t know where it is going.
When, in reality, it is the opposite. We know. And we also know what we don’t know. And that is equally as important.
The NHC, through research, found that 2/3rds of the time they produce a forecast for a tropical system track, the tropical system falls within a certain number of miles from where they projected spot would be.
The Forecast Cone is there to give you an idea about where a storm is going to be at up to five days in the future. The reason it is a cone and not a line with a point is because we know we can’t tell you something as specific as that. So, the cone is just an area, around each point, that is the average error for a particular point in time in the future.
It is broken down like this….
| Forecast Period (hours) | 2/3 Probability Circle, Atlantic Basin (nautical miles) | 2/3 Probability Circle, Eastern North Pacific Basin (nautical miles) | 2/3 Probability Circle, Central North Pacific Basin (nautical miles) |
| 12 | 26 | 25 | 34 |
| 24 | 39 | 38 | 49 |
| 36 | 52 | 51 | 66 |
| 48 | 67 | 65 | 81 |
| 60 | 84 | 79 | 95 |
| 72 | 100 | 93 | 120 |
| 96 | 142 | 120 | 137 |
| 120 | 200 | 146 | 156 |
The NHC understands that tropical cyclones (be it Tropical Depressions, Tropical Storms, or Hurricanes) don’t go in a straight line, tend to not follow model guidance perfectly, and can be influenced by other atmospheric interactions. That means that today, five days out, the possible accountable error is up to 100 miles from the center of the cone.
That may seem like a lot, but a forecast for a big event to occur within 100 miles is actually pretty precise.
That means on the map below, the NHC forecast point is on the tip of Florida, but by 8a on Thursday, in this case, Tropical Storm Grace could be anywhere from off the east coast of Florida to the western tip of Cuba.
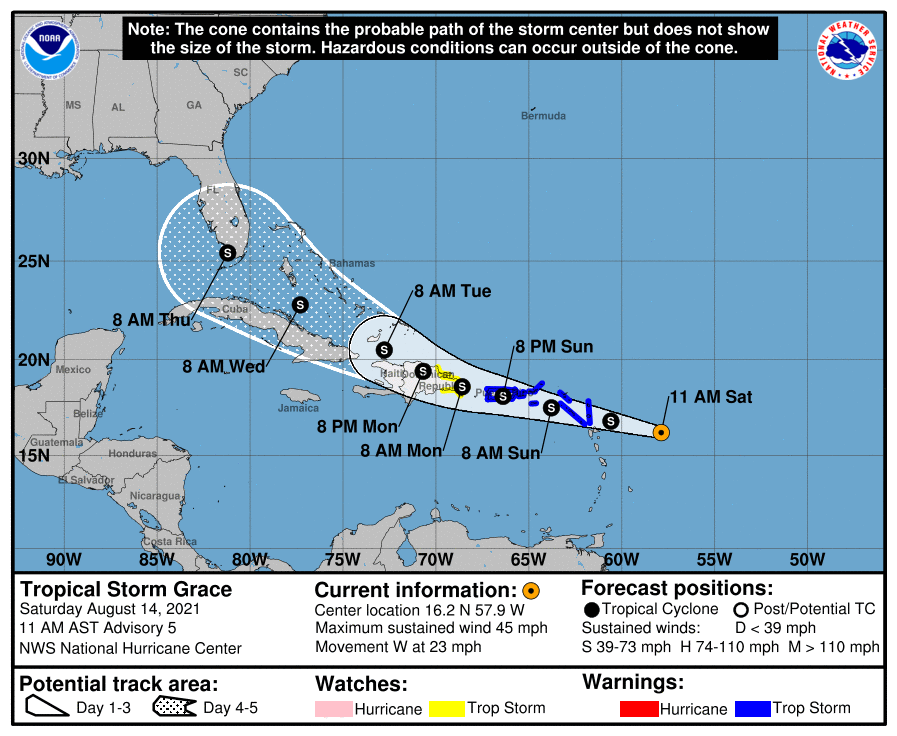
But the NHC isn’t perfect. That is why they say 2/3rd of the time. In this case, Tropical Storm Grace was outside of the cone.
But still better than just looking at the spaghetti plots.

In fact, the spaghetti plots would’ve had people from Miami to Jacksonville to New Orleans to Havana thinking they were going to get hit. When in reality, only Miami and Havana needed to prepare.
And while this forecast wasn’t as accurate at five days out, honestly, I used this example on purpose. Because when storms are disorganized, the forecast will always struggle. But when systems are well-defined and organized, the forecasts from the NHC are superb.
Even back in 2017 with Hurricane Irma, the NHC did a great job at identifying the turn northward, where it would happen, when and how far inland Irma would go. And they did it days in advance.

THE BOTTOM LINE
I know the NHC isn’t perfect. The NHC knows the NHC isn’t perfect. But they are the best we have and, despite their imperfections, they do a fantastic job. Especially with an organize and establish tropical system.
These are just two examples from the last few years. And there are countless others.
You can always trust the forecast from the National Hurricane Center to be the most accurate look at the weather forecast for a tropical system and offer the most realistic and likely area to be impacted. They aren’t perfect. They won’t be right 100-percent of the time. But they are better than any other option available. And they have a fantastic track record of accuracy.


