It turns out that the Karrie Meter has gained a lot of traction during the last seven years. In fact, we are coming up on the seven year anniversary of its unveiling. But not everyone knows what it is. So I’m here to help. If you’re late to the party, don’t worry! Let’s go back in time… all the way back to 2016!
That’s right, the first time I put the “Karrie Meter” on TV was back in February of 2016!
There was some indication that the following week there would be the potential for some severe weather.
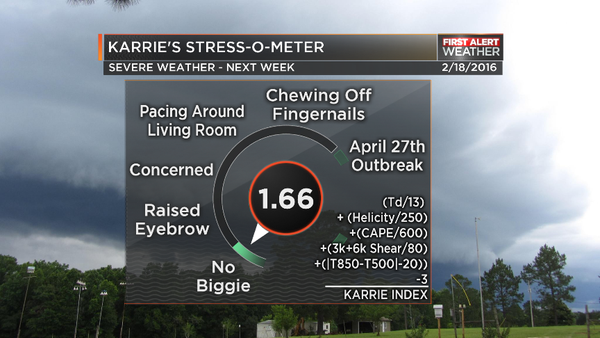
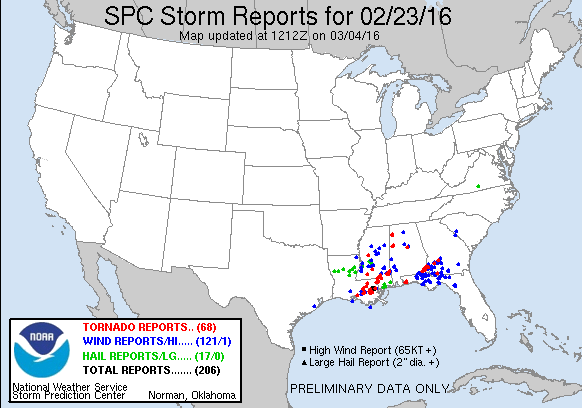
I was a bit more interested in the potential, the SPC noted that predictability was too low. Perhaps they were right. Because the original Karrie Meter showed a 1.66. And the final number would later be a 4.08 and the SPC Risk level would be a Moderate, a 4-out-of-5.
And there was plenty of severe weather that day…
The debut was, not exactly, a win. But that’s okay. That’s Science. Not everything is a slam dunk every time. Especially the first time.
So what is this thing, anyway?
It is a severe weather parameter that has measurable skill in predicting the potential for severe weather along the central Gulf Coast – from about Lake Charles to Tallahassee and about 250-300 miles inland. It was developed through research I did in my spare time, in the evening and on weekends, while I worked at WDAM in Hattiesburg, MS.
It is on a 1-to-11 scale. And, because of that, when divided in half it can also be directly comparable to the SPC outlook.

The Karrie Meter is:
(Surface Dewpoint / Historical Average)
+ (Helicity / Historical Average)
+ (ML CAPE / Historical Average)
+ ((3k shear + 6k Shear) / Historical Average)
+ ((Absolute Value of 850mb Temp – 500mb Temp) / Historical Average)
-3
___________________________
Karrie Meter
The “TOR Potential” is a new wrinkle where I’ve looked at other localized parameters that have been correlated, through other research, with tornado development. I take that number and use it as a ‘multiplier’ so to speak, to give a number that can be ratioed against the Karrie Meter. A “Tor Potential” number that is higher than the Karrie Meter indicates tornadoes are more likely than and a number lower means they are less likely .
The TOR Potential number doesn’t really have a scale. Instead it should be used as a comparison against the Karrie Meter. In the above example, the threat for tornadoes is pretty “typical” while a number that was closer to “8” or “9” in that spot would indicate a much higher risk while a “2” or “3” would indicate a lower risk (more on that later).
How did you come up with it?
I worked with a wonderful person during my time at WDAM-TV in Hattiesburg. Karrie Leggett-Brown was the station’s main anchor and someone who struggled with, self-diagnosed, severe weather anxiety, So I set out one day to quantify it. And the goal was to use Karrie’s quantified anxiety as a medium to convey severe weather risk. Humanize the threat!
And I got there by noticing two things simultaneously: First, there were certain situations where severe weather wouldn’t happen even if a lot of the pieces were in place, and it usually had to do with a handful of certain parameters. And second, when I would talk about these things on TV, it turned out that Karrie would have different (negative) reactions to them.


I kept pretty detailed notes about a lot of the parameters that went into make severe weather during my first two years on TV in Mississippi. Things that most people wouldn’t bother writing down. The 500mb temperature and wind direction, the 700mb dewpoint, the surface humidity. And all of this would eventually go into the final equation. Because, as it turned out, the stuff mattered.
I wanted to marry the two things in an effort to streamline communication of a potential severe weather risk. The ole ‘Kill two birds with one stone’ game. And I wanted it to be on 1 to 10 scale that would be understandable by a non-meteorologist.
As some of you know, I used to talk about some pretty sciencey stuff on TV. So discussing a new parameter – in my opinion – wasn’t that big of a deal. Especially since it was going to be on a 1-to-10 scale. Funny story (for another day) is that management thought otherwise, and nearly banned me from using it on-air.
So I got to work! Researching different parameters historical significance for severe weather, looking back through my own notes and comparing the data to the severe weather outcomes and reading a TON of research papers. The one thing I learned: It turns out being a meticulous note-taker when it comes to weather can be useful if you, one day, decide to come up with a new way to predict the weather.
Using the background knowledge of about a dozen research papers, the SPC and my own notes, I came up with the following value limits:
Surface Dewpoint = 13 (From reanalysis of past local events forecast)
Helicity = 250 (From the Tornado Environment Browser)
CAPE = 600 (From the Tornado Environment Browser)
3k + 6k Shear = 80 (From the Tornado Environment Browser)
Absolute Value of 850mb Temp – 500mb Temp = 20 (From reanalysis of past local events forecast)
Then I did just about the easiest thing. Addition.
Karrie’s Anxiety = Surface Dewpoint (C) + Helicity + ML CAPE + (3k shear + 6k Shear) + (Absolute Value of 850mb Temp (C) – 500mb Temp (C))
While I could keep the units here, I decided to drop them because, ‘why not.’ So, for a lower end threshold, you get:
Karries’ Anxiety = 13 + 200 + 1200 + 80 + 20 = 1513
But 1513 isn’t very meaningful to the Public. To a Scientist, sure. Because we like numbers. But to a regular person who is trying to assess risk, a number like 1513 doesn’t mean anything at all.
But wait, that is just the numbers. We need to know how the upcoming event compares to that baseline case. Because anything below that should, technically, mean no severe weather. And, in fact if you take those numbers and simply divide them by themselves you should get 5 since there are five parameters.
Karrie’s Anxiety =
(Surface Dewpoint / Historical Average)
+ (Helicity / Historical Average)
+ (ML CAPE / Historical Average)
+ ((3k shear + 6k Shear) / Historical Average)
+ ((Absolute Value of 850mb Temp – 500mb Temp) / Historical Average)OR
Karrie’s Anxiety =
(8/13)
+(275/250)
+(700/600)
+(35+50)/80)
+(|9-(-19)|/20)
_______________
= 5.81
And 5.81 feels like a number people can grab a hold of and understand. If “5” is the middle ground, then the difference is 0.81!
But that doesn’t seem to carry much weight, either.
I decided to check and see how high the scale could go as a way to balance the scale. I found one of the worst regional severe weather outbreaks on record and plugged in some new numbers. Which ones? April 27, 2011. That day is a day few people who live down here can forget. It still, I believe, holds the record for most tornadoes in a single day for Mississippi and Alabama (don’t quote me here).
The Karrie Meter on that day: 13.5. So, one could argue that 13.5 is a devastatingly bad day. Full of high anxiety.
That put the scale between a “5” as the basic severe weather day to “13.5” as a day with terrible severe weather. Still not good enough. I wanted a 1-to-10 scale.
Welp, I said, let’s just subtract 3. Because that way I know the worst of the worst is a 10(ish). It also puts a bottom of the barrel severe weather day at a “2” which gives me room to showcase to folks when the threat is lower than what it normally take to get severe weather. Plus having the top above a 10 means that there is some wiggle room on the scale.
By coincidence, it turned out that it also did a pretty good job at predicting the Storm Prediction Center ‘Risk Level’ too. Since the SPC is on a 1-to-5 scale and the Karrie Meter is a 1-to-10(ish) scale, all you had to do was divide it in half.
But does it work?
It does pretty well. I stopped keeping stats after 2020. I figured after 2016, 2017, 2018, 2019 and 2020 that I had grabbed enough of a sample size to make sure it was an accurate equation.
Between December 2015 and January 2020 The Karrie Meter identified the Severe Risk level for South Mississippi about than 85% of the time at Day 2 and about than 75% of the time at Day 3
Yes. the “Risk Level” not the number of severe storms or the number of tornadoes. Because it tends to do a good job at lining up with the SPC, it can be used to predict the SPC Risk for that day well in advance.
Here is an example where four and six days out the Karrie Meter accurately predicted the Risk Level for two different severe weather events in the same week. The maps below are the Day 1 SPC outlooks for the 19th and the 21st.

Here is another event from nine (9!) days out.

Here is example where the Karrie Meter predicted a Marginal Risk for the next day, but the SPC didn’t show a risk.

But eventually, it did, the next day in the afternoon.
So, again, after five years of this, I’ve honestly stopped counting. Not because I’m sure it is perfect, but because I’ve tallied the numbers over a large enough sample size to be satisfied with the results.
Where does it go from here?
I think the next step is the TOR Potential portion of the Karrie Meter. Using some of the newest research to identify some of the factors that go into localized tornado formation as a piece of the Karrie Meter should push the meter to a place that has added utility in severe weather situations. Because people want to know if they have to worry about tornadoes or not. And we are learning a lot about what goes into making tornadoes versus when they don’t actually form.
The National Weather Service in Birmingham has taken a similar approach to their warning decision process. They’re looking at things like the low-level environment to make sure that tornadoes are possible given the parameters in place, before they issue a tornado warning on a rotating thunderstorm.
I’d also like to expand the Karrie Meter to include more geographical locations.
The other side of this is motivating others to go down the same path.
I’ve presented at a few scientific conferences about the Karrie Meter, encouraging people to make their own for their own area and I’ve given talks at schools about how students can apply themselves to do some pretty cool stuff if they just sit down and think.
So Happy Birthday, Karie Meter! You’re turning Seven! And I can’t wait to see where you go from here and what you eventually grow up to be!


