Not much has changed regarding the potential for severe weather on New Year’s Eve. Instead, we are starting to get a better idea about how the severe weather threat will shake out as we are a bit closer in time now and the model guidance is better at resolving specifics within the potential outcomes.
What does that mean for you? More details and more information that can (hopefully) help you plan.
From the SPC
The SPC bumped up the Risk to an Enhanced Risk across parts of Louisiana and Mississippi.

This isn’t all that surprising given the data that is available. We will be discussing that in greater detail in the next few sections.
First here is the discussion from the SPC:
…Synopsis…
An upper pattern featuring split flow will persist across the U.S. Thursday. In the southern stream, a low over northern Mexico at the start of the period is forecast to rotate northeastward and then northward across central and eastern Texas and into Oklahoma late. Meanwhile, a short-wave trough emanating from the northern stream is forecast to dig rapidly southward across Nevada and California, eventually evolving into a second low over the southern Arizona/northwestern Mexico vicinity through latter stages of the period.
At the surface, the primary feature will be a low initially near the southern Texas coast. This low is forecast to deepen gradually through the day, as it shifts north-northeastward into southeastern Texas.
Overnight, the northward drift will continue, with the low reaching eastern Oklahoma/Arkansas and occluding through the end of the period. As the low shifts northward, low-level theta-e advection off the Gulf of Mexico will occur across the lower Mississippi Valley/Gulf Coast states, ahead of a cold front which will sweep eastward across Louisiana and Mississippi through the second half of the period.
…Southeast Texas to Alabama and western parts of Florida Panhandle…
Showers and scattered thunderstorms will be ongoing at the start of the period across portions of central and eastern Texas, including a few stronger/possibly severe storms in the vicinity of the middle Texas Coastal Plain. With time, as the surface low deepens and shifts northward into southeastern Texas, continued influx of higher theta-e air and very limited heating will permit some intensification of convection to occur, as storms spread across southeastern Texas and into Louisiana.
Aiding the convective intensification/organization will be an increase in both low-level veering, and deep-layer shear, to the east and northeast of the low as it begins to occlude. Along with potential for locally damaging winds and possibly hail, risk for tornadoes will increase, as shear becomes increasingly favorable for low-level storm rotation.
With time, threat will diminish from west to east as a cold front trailing from the northward-moving low advances across east Texas, and into Louisiana during the evening. Greatest tornado risk appears likely to evolve from late afternoon through mid evening, both ahead of the cold front across southeastern Texas and western Louisiana, and near a northward-moving Gulf warm front from central Louisiana into southwestern Mississippi.
Overnight, some risk will spread into Alabama, and eventually western portions of the Florida Panhandle, where potential for locally gusty winds and a tornado or two may linger through the end of the period.
SPC.NOAA.GOV
Updraft Helicity Streaks are inconclusive so far
The Updraft Helicity streaks are becoming available are more and more short-range model guidance. It is super helpful. Because while our model guidance isn’t perfect with placement and timing, it is good at delineating between a stout environment for producing severe weather and one that is not.
Recall that these UH Streaks are the computer trying to find where the strongest storms will be by trying to pick out the places with the strongest rotating updrafts.
In this case the UH Streaks between the model guidance that is available isn’t quite as helpful as usual. A lot like with the Analog data from yesterday, there is a pretty hefty split between the models that is close to 50-50.
The placement of the streaks isn’t as important here. Instead I tend to look at the density and intensity. In other words, how many are there and what is the brightest color on the map?
In this case there are a few that are pretty densely packed and others that are nearly barren. And the intensity seems to remain relatively low (only gray shading). I say “relatively” there because that gray shading is in the 50m/s to 75m/s range. That is the lower-end of the scale, based on past research like this, for getting tornadoes to form.
Once you start getting into the 75m/s to 100m/s that is when you start to talk about stronger tornadoes. And once you get above 125m/s you start to talk about days like Easter 2020 and January 2017 (At least, that is, historically for the Gulf Coast within the modeling).
For now, I would say these data neither help nor hurt the conversation about the threat for tornadoes. So we are going to have to move on to other data to see if that is more helpful.
CIPS Analogs
History is always a good teacher. I’ve found that in meteorology pattern recognition is almost as important as all of the math we do. If you have the ability to see something in the modeling and recognize it and recall what happened last time it looked like that, you will have a pretty decent forecasting career.
The problem with that, of course, is that without experiencing previous weather, how can someone know what happened last time? Great question! The answer is “reanalysis data” where we pull up old forecast data and compare it to what actually happened.
Does this sound familiar? It sounds like the CIPS Analogs!
Here is a look at the Top 15 most similar situations to this upcoming event and what happened – severe weather-wise – during those events.

Compared to yesterday (7 SVR vs 8 non-SVR), the split is now…
5 – Severe Events
10 – Nothin’ Burgers
Still not great odds, but we are trending a little better.
Underneath the hood, though, when you go into the data, the findings show that this event is a bit more humid and the placement for the pieces of the puzzle are slightly off from the average of all of the events above. And when you go in and look at each individual event something sticks out.
5 – Severe Events (feature greater than 500 J/Kg CAPE)
10 – Nothin’ Burgers (lack greater than 500 J/Kg CAPE)
And in this upcoming event CAPE values will be up around 1000 J/Kg across parts of Louisiana – double the threshold met by all of the five severe events within the analogs.
And when you look at the individual threat potential within the guidance from the CIPS you also find that during a few of those “Nothin Burger” events there was still a “Somethin’ Burger” happening.

And that bullseye from the NAM data of the CIPS is also lines up with the GEFS data.

So for folks in Louisiana – from Alexandria to Morgan City to Baton Rouge to Hammond, and points nearby and between – you need to keep a close eye to the sky on New Year’s Eve.
Karrie Meter
The Karrie Meter isn’t as impressed with this setup. A bit surprising at face-value, but when you think back to how it is derived, it makes sense. The Karrie Meter tends to handle cold-season events pretty well because it is CAPE dependent and leans on Shear and Helicity values a bit more. In this setup those are the exact puzzle pieces we are working with! And those values are all within “tolerable” Karrie Meter limits within the warm sector.

This is why I really appreciate the KM. While I am totally biased, since I came up with it, I have to say it balances things out pretty well to give an even-keel assessment of the atmosphere for severe weather development.
Here is a look for the Karrie Meter around midnight as we ring in the New Year.
This is a good example of two things. The first being “where does the Karrie Meter fail?” And the answer is “In places with an outlier parameter that is 3 standard deviations above the mean” like in Arkansas at this time.
The second is it highlights the isolated nature of the enhanced severe weather environments. This is going to be a pretty conditional event for a lot of the area. The NAM data is able to resolve things down to a finer scale and can pick out where the environments will be capable of prodcuing severe weather, and it doesn’t look like there will be a gigantic line of severe storms, but rather a line of storms with embedded severe storms within it.
It also shows the potential for severe storms to develop ahead of the main line of storms.
It also shows the area with the highest threat to be the same area in Louisiana as the CIPS Analogs was showing.
Timeline
We are close enough that the short-range guidance can actually pick things out enough to the point where an accurate timeline should be available. But, for this event, it is tricky. Because it depends on which set of data you look at.
Usually between guidance there may be a difference of an hour or two. Which is annoying, but manageable.
With this event, the difference in timing is up to six hours. Still.
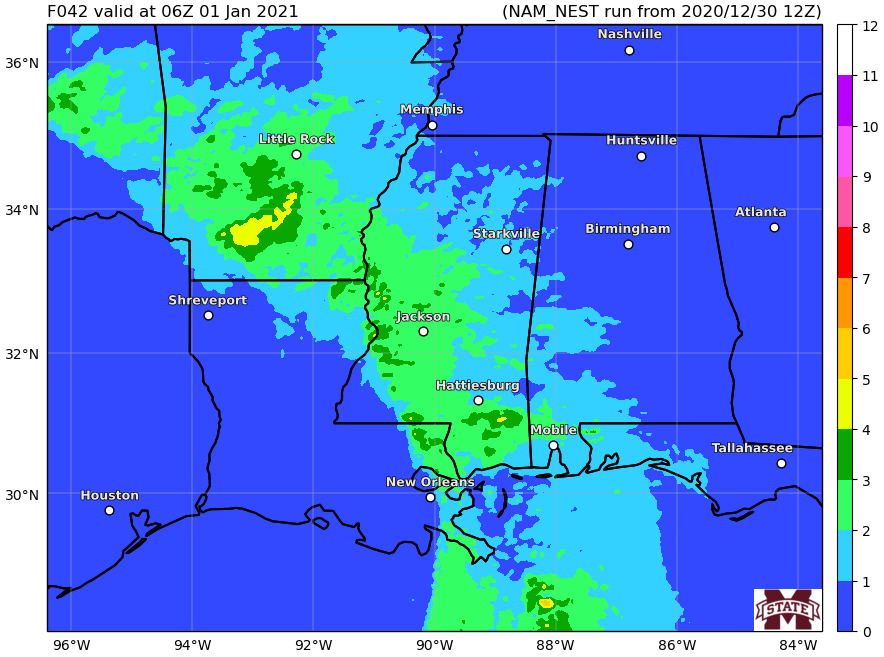
The above loop shows where the rain will be around midnight as we flip the calendar over to 2021. There is still a decent spread between the guidance. And at this point things should really start to be tightening up.
So I’m going to leave things as-is – with an asterisk.

That is the timeline, but I would leave two hours of wiggle room on each end.
Keep in mind, due to the nature of this event, the timeline does not indicate how long it will be raining. Instead it indicates the timeline for the highest risk for the threat for severe weather.
The Bottom Line
Showers and storms will be possible New Year’s Eve all along the Gulf Coast region – from east Texas through Louisiana, Mississippi Alabama and the Florida panhandle. Storms will start in the late morning and early afternoon in Texas and move across the region through the day, afternoon, evening and into the overnight hours.
The main concern with these storms will be… Heavy rain, localized flooding, frequent lightning, wind gusts up to 70mph, hail up to the size of quarters, and the potential for a few tornadoes. There is the potential for tornadoes as strong as EF-2 or EF-3. That potential is supported both within the raw data and from the analogs.
Picking out where the strongest storms will be is still not possible. The UH Streaks we looked at were reasonably inconclusive, though the guidance suggests that southeastern Louisiana may see the roughest of the weather.


