Introduction
Hello! Thank you for taking the time to read my second research project this summer! This time, I decided to do something more analytical compared to my last project and compare how forecasted high temperatures among the HRRR, GFS, and NAM models vary based on the soil moisture index in Hattiesburg, MS.
I was inspired to complete my project on this topic because in droughts and dry spells, one of my favorite weather events, the high temperature has been known to get hotter than it otherwise would have been if there wasn’t a drought and the ground was moist. This is due to the concept of specific heat capacity, which is the amount of heat energy necessary to heat up a unit mass of a substance by 1ºC. Water has a very high specific heat capacity, meaning it takes lots of energy to raise its temperature, while air has a much lower specific heat capacity. This concept is critical when understanding the relationship between droughts and heatwaves, because if the ground is dry, less solar energy goes into evaporating soil moisture, and more goes into heating up the air right above the soil. Therefore, afternoon high temperatures have been known to rise higher when the soil is dry. That made me wonder how soil moisture impacts forecasted high temperatures and if any sort of warm or cold bias among major weather models exists in high temperature forecasting.
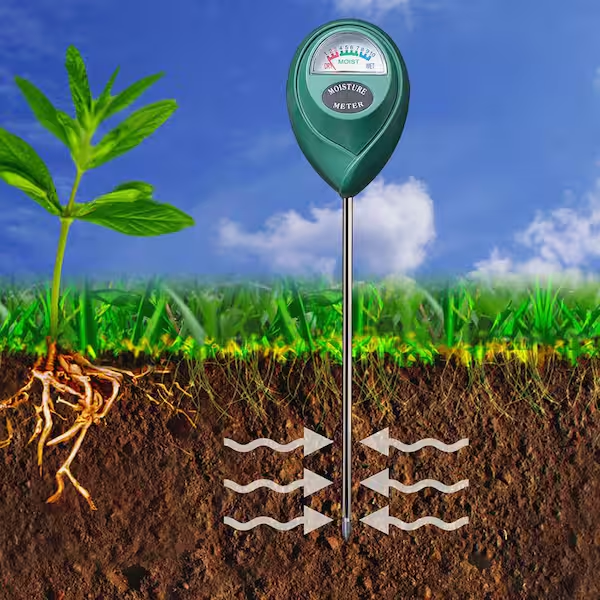
Before I get into it, I would like to explain the soil moisture index. The soil moisture index is a numerical parameter that’s used to determine the amount of moisture in the ground at a certain depth. Values generally range from 0 to 1, with 0 being completely dry and 1 being completely saturated. Values sometimes exceed 1 when the soil is exceptionally saturated, but can never be smaller than 0. Values between 0 and 0.3 are generally considered dry, values between 0.3 and 0.7 are generally considered to be normal, and values greater than 0.7 are generally considered to be wet.
Methods
In this project, I analyzed a total of three different 30 day time periods where the soil moisture index at a depth of 15 cm below the surface was anomalously low or high. The first time period I chose was September 4, 2023 to October 3, 2023, which is when the soil moisture index was very low, generally between 0 and 0.2. The second time period I chose was July 14, 2025 to August 12, 2025, which is when the SMI was relatively low, generally between 0.2 and 0.4. The last time period I chose was May 28, 2026 to June 26, 2026, which is when the SMI was high, generally greater than 0.8. I chose to only analyze the warm season months to avoid accidentally accounting for differences in sun angle, sunset time, snow cover, and other factors that may influence forecasted temperature bias. The three 30 day time periods are in three different years so that large-scale atmospheric circulation patterns don’t produce similar results in spite of soil moisture differences. This data was obtained using the Meteomatics API.
Next, I wrote a python script in Jupyter notebook to extract past weather model forecasts for the time periods mentioned above. I installed the python package Herbie to get access to this data. During this step, I extracted the highest temperature during the forecast hours 6-12 on the 12 UTC run of each weather model, which corresponds with 1-7 PM Hattiesburg time. The daily high temperature is almost always between those times. I chose the 12 UTC run because it is the last run before part of the afternoon goes by. Choosing such a short lead time also ensures that unexpected changes in things such as cloud cover and wind direction have already been accounted for by earlier runs. This allows the soil moisture to have the largest possible impact on the daily high temperature.
Then, I gathered official NOAA daily high temperature data for Hattiesburg during those time periods and compared the forecasted high temperature of each weather model with the actual high temperature. To get the forecast error, the observed high temperature was subtracted from the forecasted high temperature, meaning that negative values indicate that the observed temperature was higher than the forecasted temperature and vice versa. From this, I was able to calculate the mean and absolute mean forecast error for each model for each time period, and produce many excel graphs.
Results
September 4, 2023 – October 3, 2023 (lowest soil moisture index)
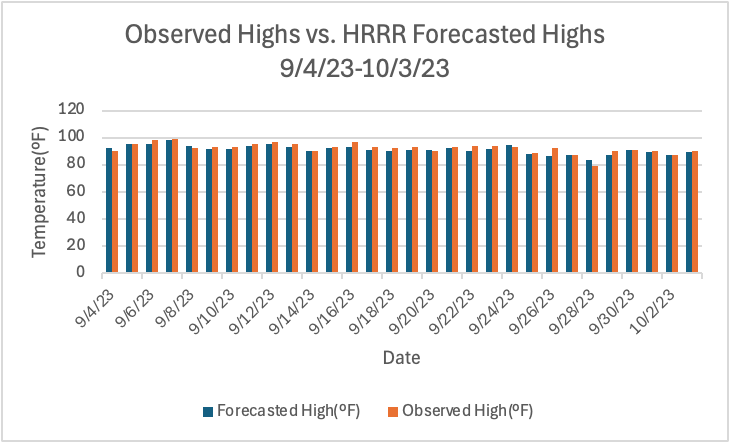
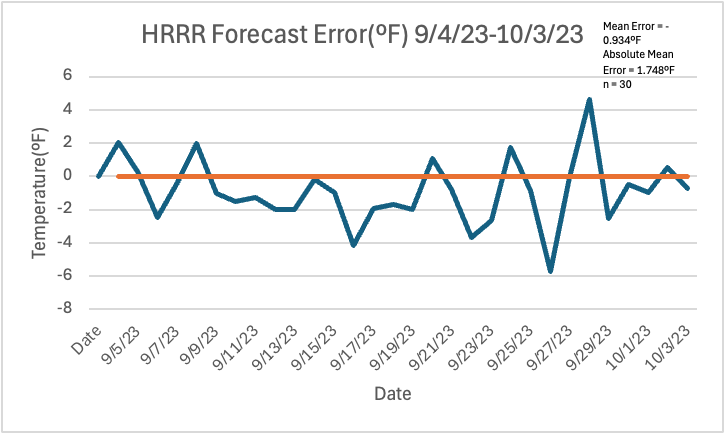
For the HRRR model, I found that the daily high temperature was underestimated by 0.934ºF, while the average error regardless of if the high was underestimated or overestimated was 1.748ºF. 7 days saw the HRRR overestimate the high temperature and 23 days saw it underestimate the high. Two days which had large errors in the opposite directions at the end of September largely cancelled each other out.
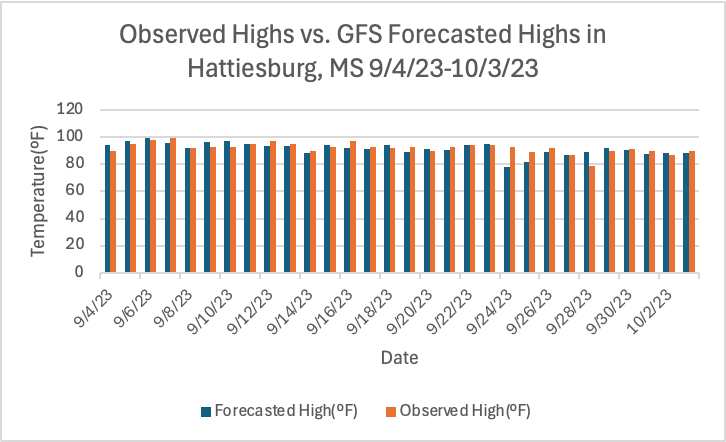
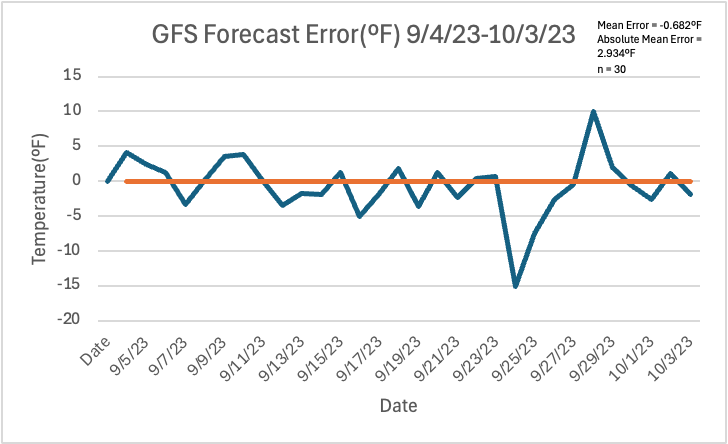
For the GFS model, I found that the daily high temperature was underestimated by 0.682ºF, while the absolute value of the mean error was 2.934ºF. The GFS overestimated the high temperature on 15 days and also underestimated it on 15 days. The mean error may also be slightly skewed downwards due to the GFS underestimating the high temperature by around 15º on September 24th.
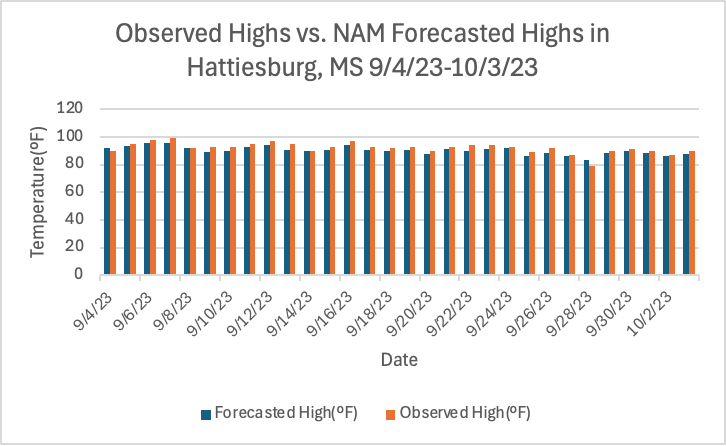
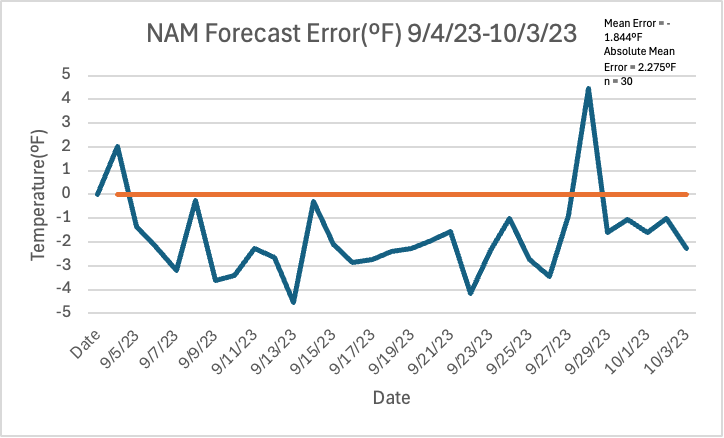
For the NAM model, I found that the daily high temperature was underestimated by 1.844ºF and the absolute value of the mean error was 2.275ºF. The NAM also overestimated the daily high on just 2 out of 30 days, the least out of the three models during this time period.
July 14, 2025 – August 12, 2025 (slightly dry period)
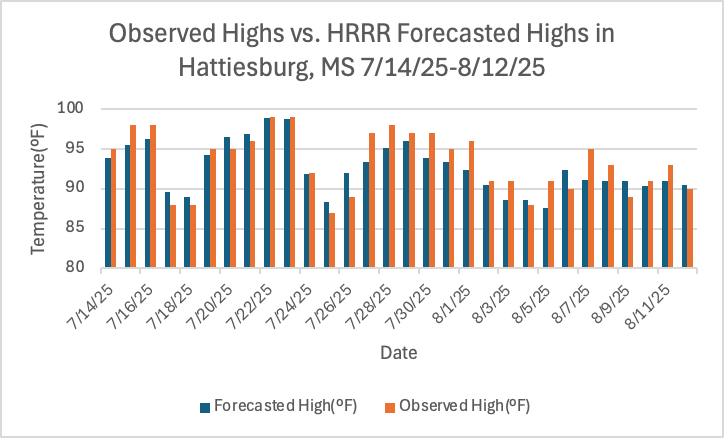
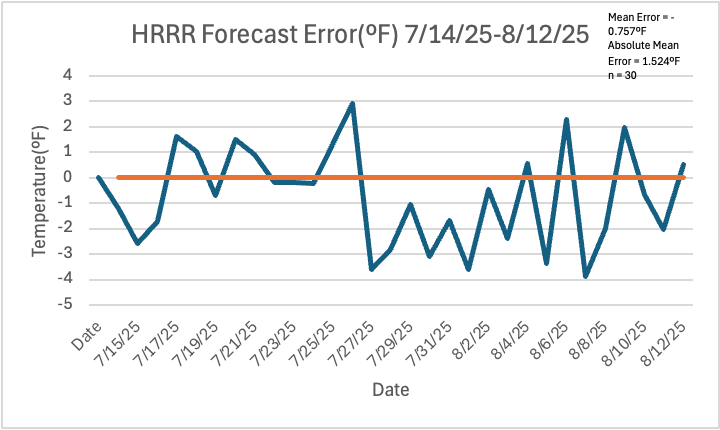
The HRRR model underestimated the daily high temperature by 0.757ºF on average during the slightly dry period in July and August of 2025. The absolute mean error was 1.524ºF. The daily high temperature was overestimated on 10 days, while the high was underestimated on the other 20.
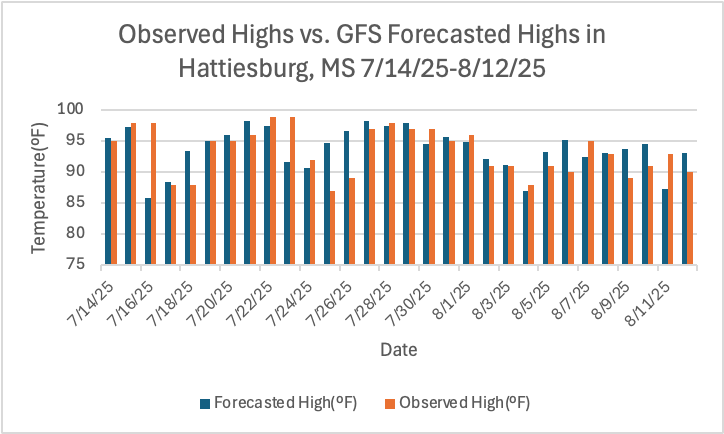
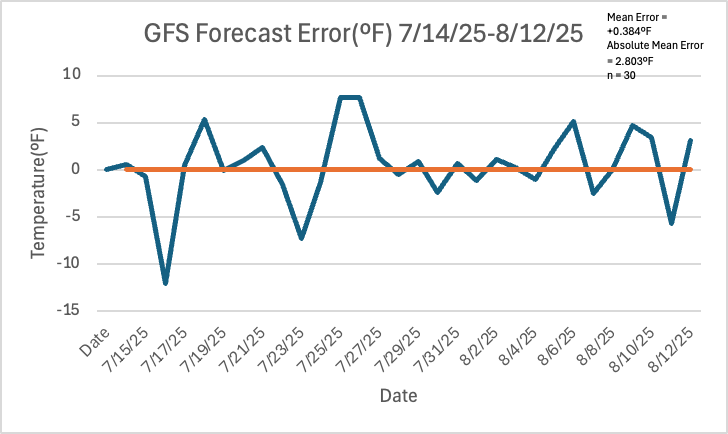
The GFS model overestimated the daily high temperature by 0.384ºF during the slightly dry period, the only time period with any model to have the high temperature overestimated on average. The absolute mean error was 2.803ºF. During this time period, the high temperature was overestimated on 18 days, while it was underestimated on the remaining 12.
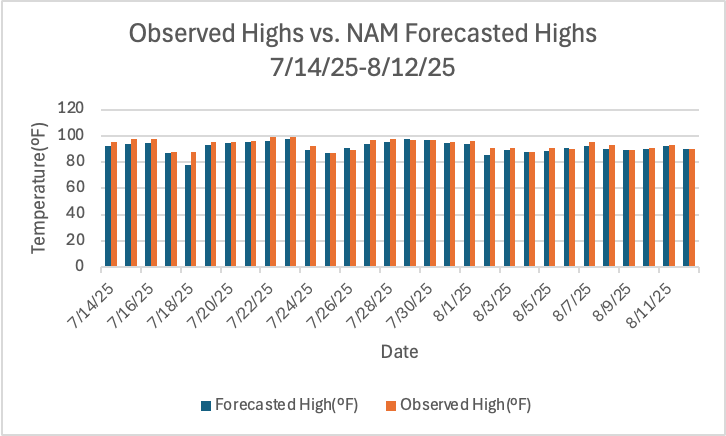
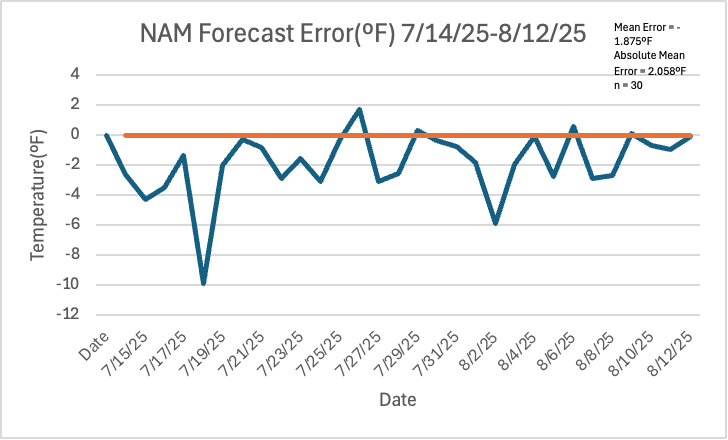
The NAM underestimated the daily high temperature by 1.875ºF on average, while the absolute mean error was 2.058ºF. During this period, the high temperature was overestimated on just 4/30 days. The mean error is skewed down by a 10ºF underestimation on July 18th.
May 28, 2026 – June 26, 2026 (period with highest soil moisture index)
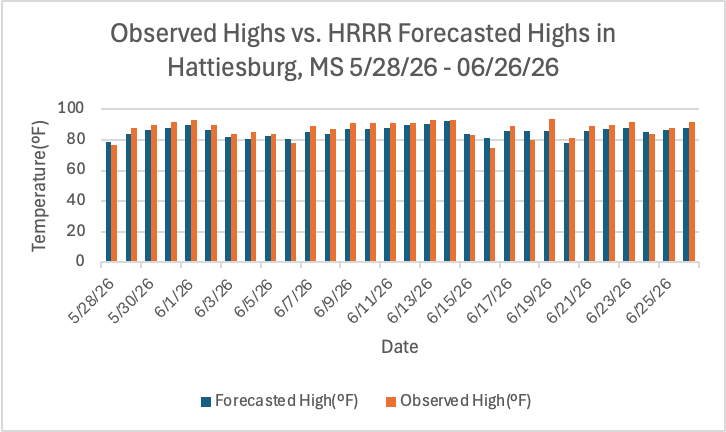
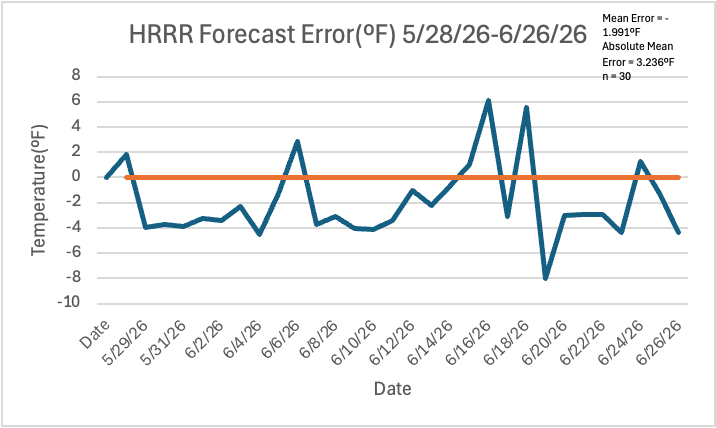
The HRRR underestimated the daily high temperature by 1.991ºF on average during this time period, while the absolute mean error was 3.236ºF. During this time period, the high temperature was overestimated on 6 days, while the high temperature was underestimated on 24 days.
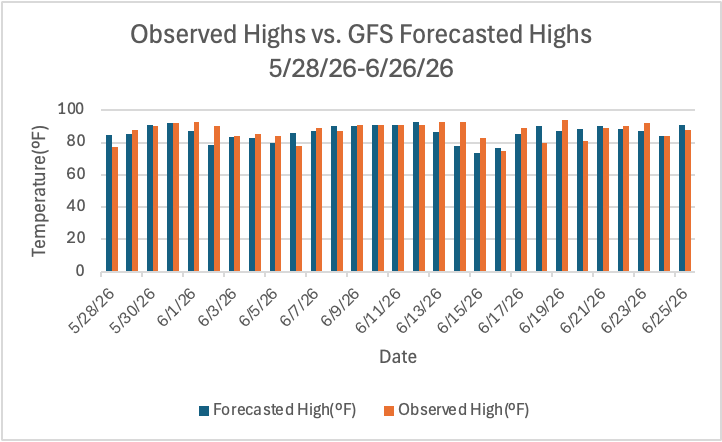
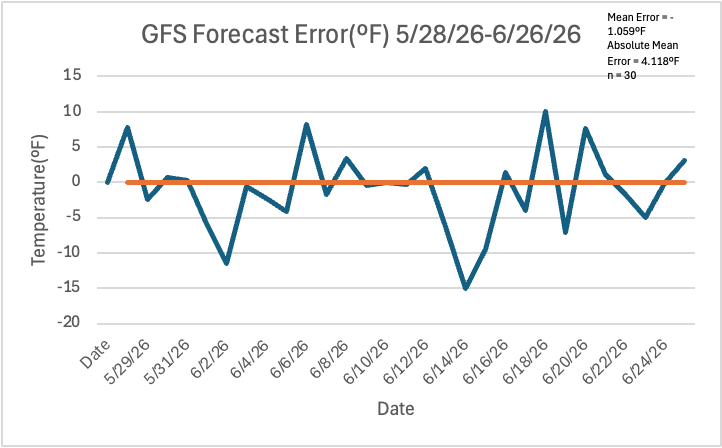
The GFS underestimated the daily high temperature by 1.059ºF on average during this time period, while the absolute mean error was 4.118ºF, the largest mean error of any time period with any model I analyzed. The high temperature was overestimated on 11 days and underestimated on the other 19 days.
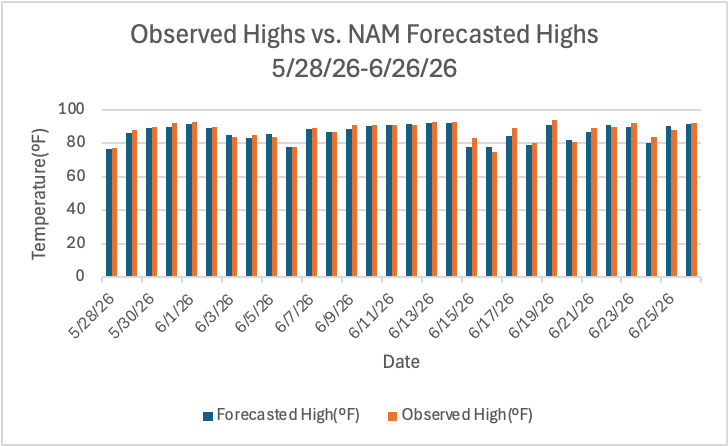
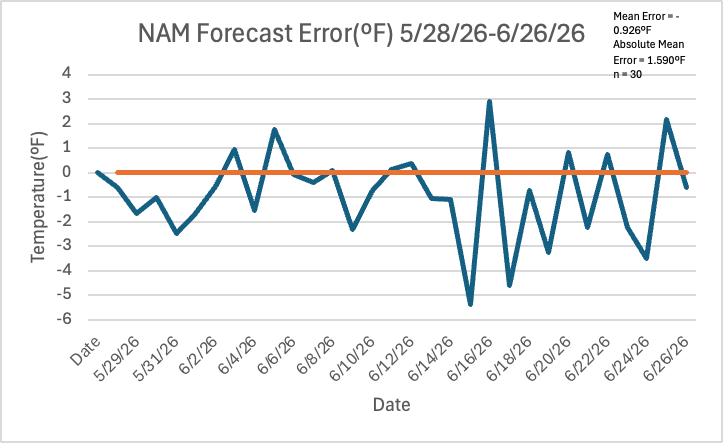
The NAM underestimated the high temperature by 0.926ºF on average during this time period, while the absolute mean error was 1.590ºF. The high temperature was overestimated on 10 days and underestimated on the other 20 days.
Discussion
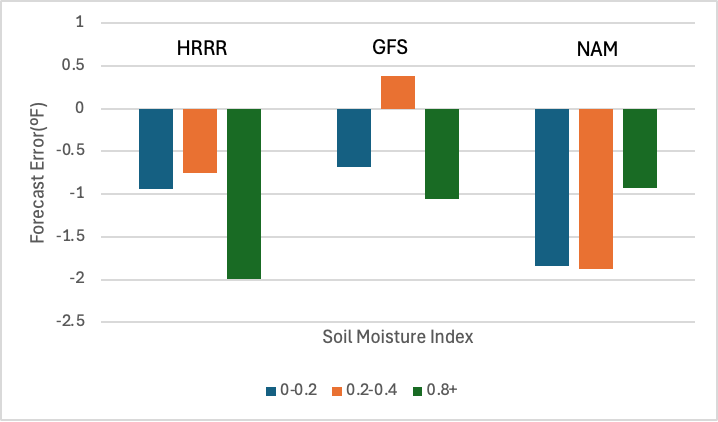
Overall, the data I collected and the statistics I computed does not tell us a whole lot about how soil moisture impacts forecasting bias among major weather models. However, it does tell us something. The main takeaway is that when the soil moisture index is closer to normal, the closer to zero the mean forecasting error becomes. This is highlighted by the HRRR and GFS models, which both show the 0.2-0.4 SMI period having the smallest mean forecasting error compared to the other two periods. The NAM, unlike the other two models, has the 0.2-0.4 SMI period having the largest forecasting error. While this may seem to contradict the idea that weather models have weaker high temperature biases when the soil moisture index is closer to average, it is important to remember that the NAM had one day where it underestimated the high temperature by 10ºF, which skews the average. Large underestimations could be caused by other factors besides soil moisture such as unexpectedly low cloud cover or an unexpected southerly wind. It’s also worth looking at the number of days each model for each time period overestimated or underestimated the daily high temperature. The average ratio of overestimated days to underestimated days among all 3 models for each time period was 0.458 for September/October 2023 (driest period), 0.718 for July/August 2025 (moderately dry, SMI was closest to average), and 0.443 for May/June 2026 (wettest period). This means that the time period where the soil moisture index was closest to average saw the most equality of days where the daily high temperature was overestimated vs. underestimated.
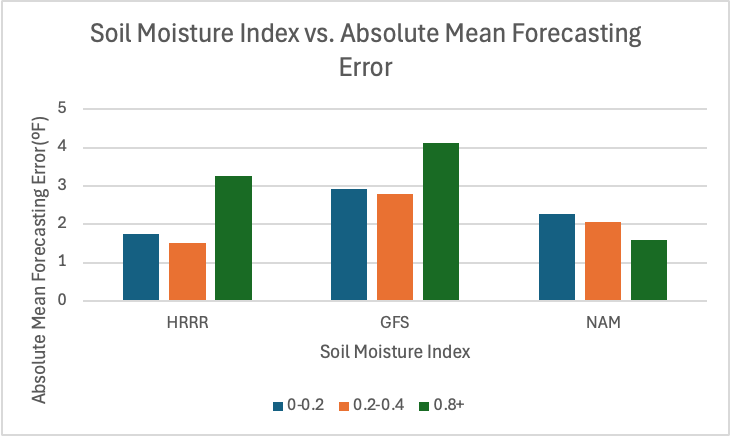
If you take a closer look at the absolute mean forecasting error, it tells us a bit more about each specific model and its accuracy. Between the three models I analyzed, it looks like the NAM has the smallest absolute mean forecasting error, while the GFS has the largest absolute mean forecasting error. From this graph, you could conclude that the accuracy of the HRRR and GFS changes the most when the soil moisture changes, while the NAM changes the least. The GFS and HRRR also seem to struggle with accuracy the most when soil moisture is very high, while the NAM struggles the most when soil moisture is very low.
Problems
While I did try to minimize the impacts of different factors besides soil moisture that impact the daily high temperature, this research project is not immune to them. The biggest problem this project has is that there are many other atmospheric and environmental factors that impact air temperature that simply cannot be eliminated. Major ones include cloud cover, wind direction, and storms, which occur nearly daily in Hattiesburg during the warm season months, the same months I analyzed. Cloud cover could be detrimental to the accuracy of this project because unexpectedly low cloud cover could lead to the high temperature being underestimated, while unexpectedly high cloud cover could do the opposite. Wind direction also plays a role. An unexpected breeze coming from the north could cause temperatures to be a bit cooler than they were forecasted to be that morning, or vice versa. Some precautions were taken to account for unexpected changes in atmospheric and/or environmental factors, namely using the latest possible model run, the 12 UTC, but they are still unavoidable at times.
Another problem this project has is that 30 days may not be long enough to properly assess how consistently high or low soil moisture impacts high temperature forecasting. 30 days is a relatively short period of time. A consistent ridge or a consistent stormy pattern that lasts for that amount of time may cause one model to perform unusually poorly or unusually well. Unfortunately, this problem is a bit more unavoidable as the weather in Hattiesburg is highly variable, meaning it’s very difficult to find a period of time longer than 30 days where the soil moisture is consistently around a certain value.
Conclusion/Final Thoughts
In summary, I found that the closer the soil moisture index in Hattiesburg was to average, the closer to 0 the mean forecasting error was. I also found that in general, the NAM is the most accurate when it comes to high temperature forecasting during unusually wet/dry periods, as it had the smallest absolute mean error, while the GFS is the least accurate. In general, it is hard to say if less bias exists in very wet periods or in very dry periods, as no real relationship between large biases in either direction and very high/low soil moisture indices was found.
In Hattiesburg, the weather is very variable. Dry spells last no longer than a few weeks (most of the time), and rainfall is very consistent. I would be curious to complete this project for a different region where dry spells can last months or even years at a time, such as the mountain west. Nonetheless, I believe that studying topics like this will be important in the future, as climate change will cause the weather to become more extreme. Wet periods will get wetter, and dry periods will get drier, so it’s important we understand how forecasting changes during these periods. I hope that interest in this topic grows as the full extent of climate change and its impacts become more realized as time passes.


