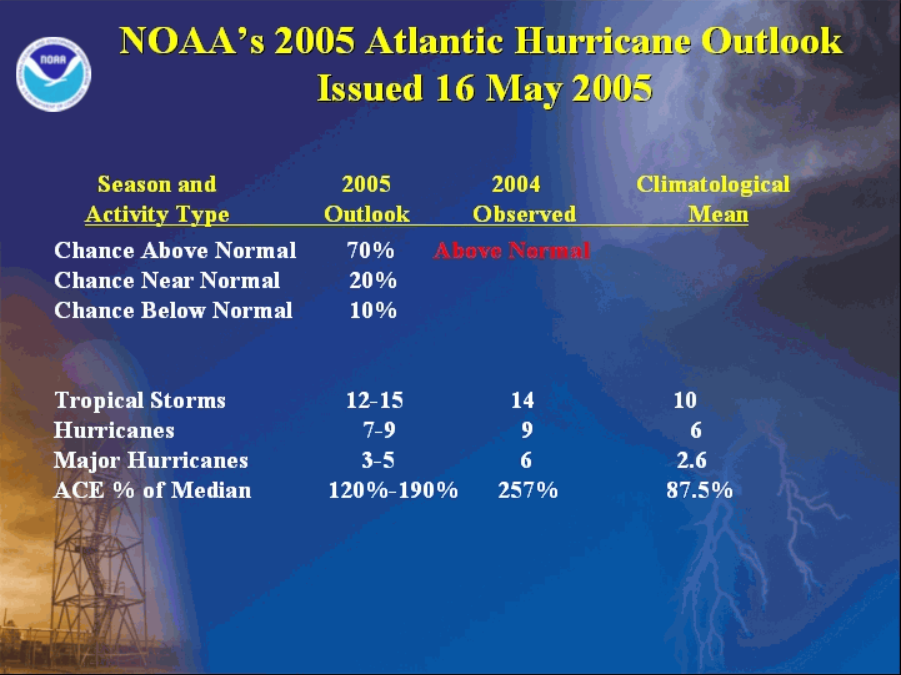
28 named storms. 15 hurricanes. 7 major hurricanes. More than $160 billion in U.S. damage. And so many storms that forecasters ran out of names. But those numbers only begin to tell the story of just how extraordinary and devastating the 2005 Atlantic hurricane season was.
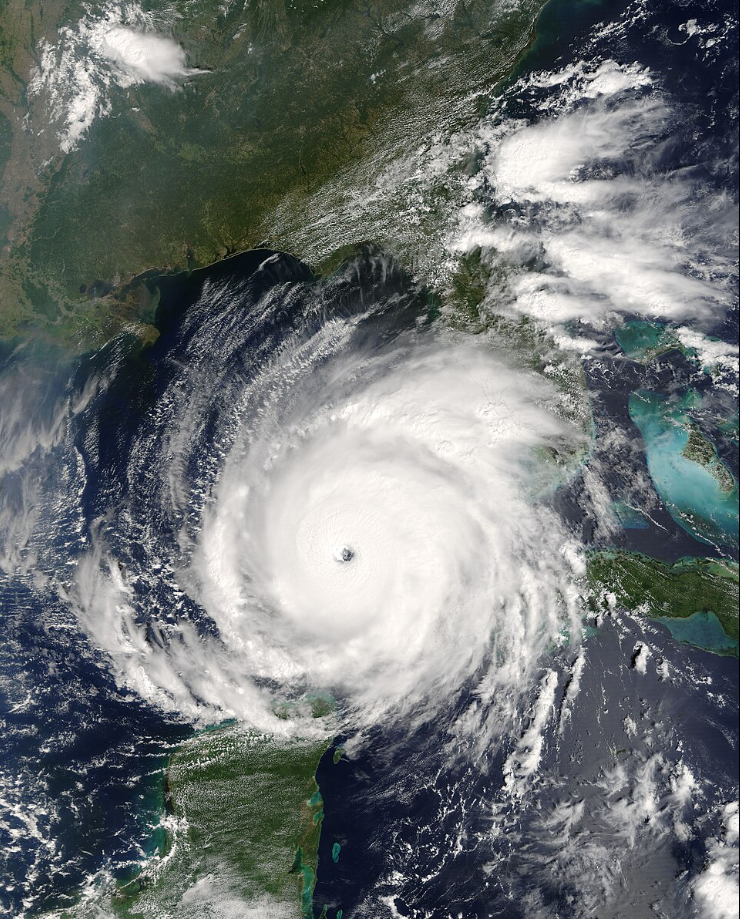
Hurricane Katrina flooded much of New Orleans and became one of the deadliest and costliest hurricanes in U.S. history. Rita forced massive evacuations across the Gulf Coast just weeks later, while Wilma became the most intense Atlantic hurricane ever recorded by central pressure. The 2005 season was so active and intense, it seemed like it was producing storm after storm from June all the way into January of 2006. But before the season was over, the Atlantic had produced so many storms that forecasters ran out of names and had to turn to the Greek alphabet for the first time in history. The 2005 Atlantic hurricane season was anything but average and is known as one of the most extreme seasons on record. So, what made 2005 so extreme?
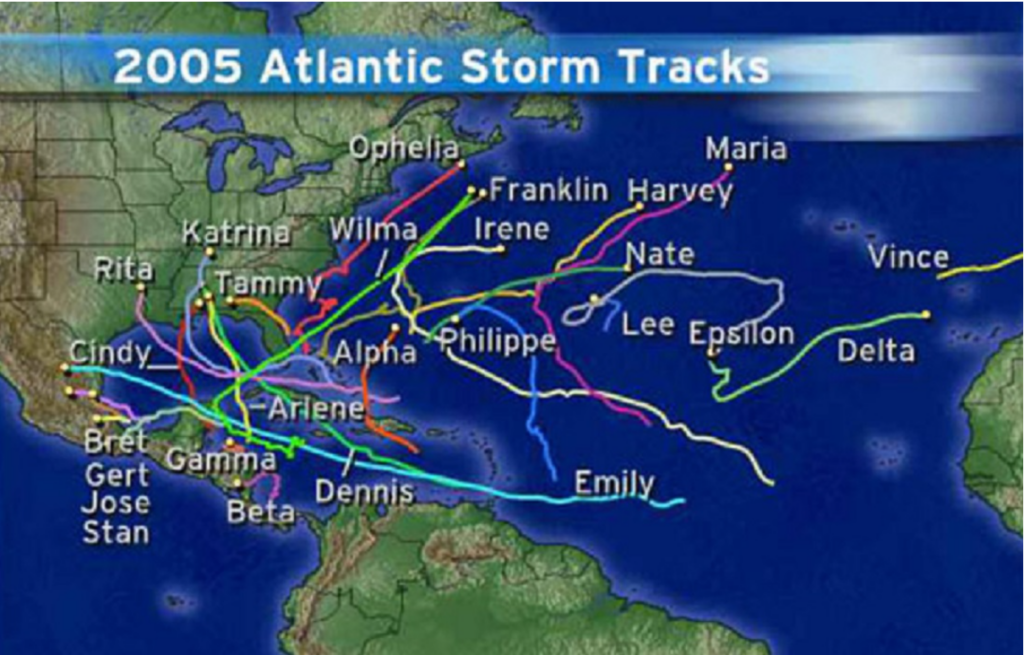
Breaking Records
To recapitulate just how intense this season was, here are some statistics highlighting just how insane this year was:
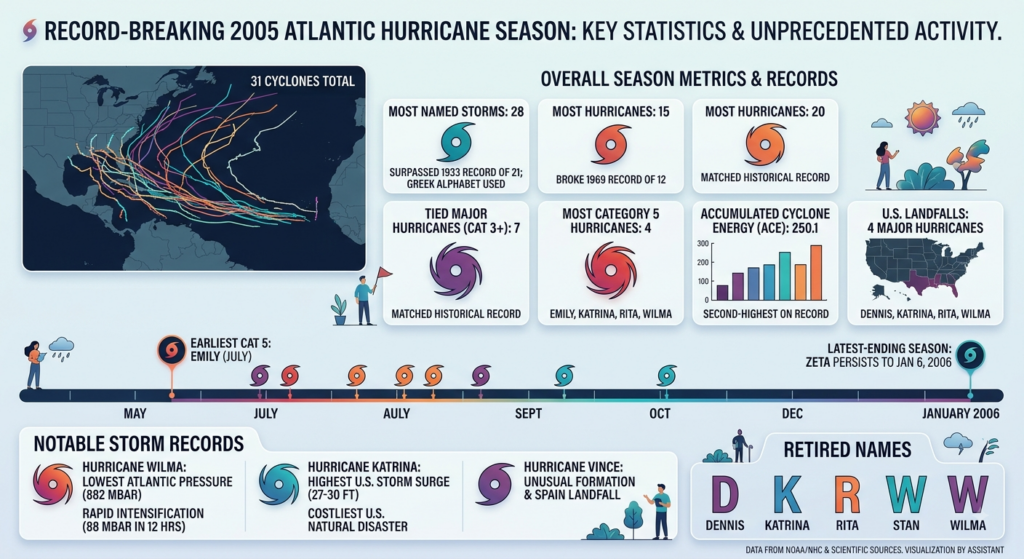
(Click arrow below)
By the numbers:
- 28 named storms- Broke the record of 21 in 1933.
- 15 hurricanes- Broke the record of 12 in 1969
- 7 major hurricanes- tying the record at the time for the number of Category 3+ hurricanes in one Atlantic season (1950).
- 4 Category 5 Hurricanes- The first and only Atlantic season to produce four Category 5 hurricanes.
- 250.1 ACE which is 104% above average, with storms producing over twice the normal cumulative cyclone energy. (ACE is Accumulated Cyclone Energy)
- 7 tropical storms before August 1- Broke the record of 5 in 1997.
- 4 major hurricanes made U.S. landfall- Tied the record of 4 in 2004.
- Hurricane Wilma reached 882 mb- the lowest central pressure ever observed in an Atlantic hurricane.
- Wilma’s pressure dropped approximately 97 mb in about 24 hours, an extraordinary example of rapid intensification.
- Hurricane Wilma intensified from a tropical storm into a Category 5 hurricane in less than 24 hours, making it one of the most extreme rapid-intensification events ever observed in the Atlantic.
- Tropical Storm Zeta formed on December 30, becoming the final named storm of the season and continuing into January 2006
- Hurricane Emily became the earliest Category 5 hurricane ever recorded in the Atlantic basin at the time. It was also the earliest fifth named storm to form in an Atlantic hurricane season at the time.
- Three of the ten most intense Atlantic hurricanes on record at the time, based on minimum central pressure, occurred during the 2005 season: Katrina (902 mb), Rita (895 mb), and Wilma (882 mb).
- For the first time in history, the naming system ran out of names. The Atlantic’s standard naming list contains 21 names, 2005 produced 28 named storms.
- Because of that, this was the first Atlantic hurricane season ever to require the Greek alphabet. The season continued until Zeta.
- At the time, 2005 was the costliest U.S. hurricane season on record, with damage estimated at $161 billion.
- The 2005 Atlantic hurricane season resulted in 753 direct deaths across the Atlantic basin, according to the National Hurricane Center’s official database.
- 5 hurricane names were retired: Dennis, Katrina, Rita, Stan, and Wilma. This was the largest number of names retired from one Atlantic season at that point.
- Katrina became one of the deadliest hurricanes in modern U.S. history and, at the time, the costliest natural disaster in U.S. history.
- The season lasted 214 days from June 8, 2005, through January 6, 2006. The average Atlantic season lasts 183 days.
These numbers and statistics alone demonstrate just how unusual the 2005 Atlantic hurricane season was. But possibly the most interesting thing about these records is that 2005 was not extreme in just one category. It was extreme in frequency, hurricane intensity, major-hurricane activity, U.S. landfalls, ACE, and individual storm intensity. That suggests something much bigger was happening across the Atlantic basin.
So, Why Was 2005 So Active?
A hurricane season cannot break records like this by having just one intense or unusual factor, and that is what made 2005 so unique. For tropical cyclones to form, the ingredients of the ocean and atmosphere must come together in just the right way, especially for multiple storms to intensify and reach Category 5 strength. A combination of warm ocean waters, atmospheric moisture and instability, sufficient background rotation, and relatively weak vertical wind shear is required for tropical cyclone development. In 2005, these ingredients aligned across much of the Atlantic, creating the perfect environment for storm after storm to develop and making the season both remarkable and destructive.
Warm Ocean Waters
For tropical cyclone formation, ocean water temperatures of around 80°F (26.5°C) are generally required to provide the necessary energy for development. Tropical cyclones draw much of their energy from warm ocean waters; as warm seawater evaporates, moisture is transferred into the atmosphere. When that moisture rises and condenses within thunderstorms, latent heat is released, warming the surrounding air and helping lower surface pressure. This process strengthens the storm’s circulation and allows the tropical cyclone to continue developing.
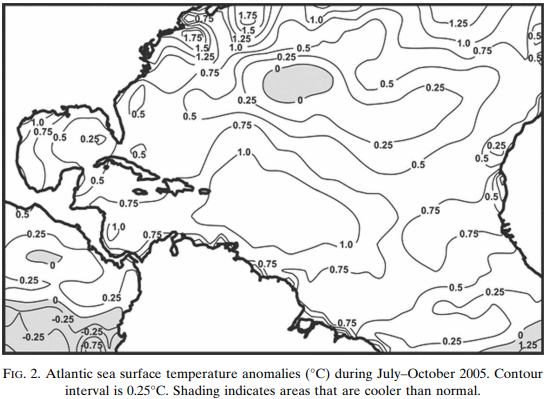
In 2005, sea surface temperatures across important portions of the tropical Atlantic and Caribbean were unusually warm, averaging about 1°C (33.8°F) above normal. NOAA states that the sea surface temperatures (SSTs) during the 2005 hurricane season were the warmest ever observed there at the time.
Because of this, NOAA’s seasonal assessments identified the warm tropical Atlantic as one of the important ingredients supporting the active season. However, it is important to know that warm water alone does not automatically create hurricanes. If strong wind shear, dry air, or unfavorable atmospheric circulation is present, even very warm water can fail to produce significant tropical activity.
Vertical Wind Shear
One of the biggest depressors to tropical development is vertical wind shear. Vertical wind shear describes how wind speed and direction change with height. Strong shear can tilt a developing tropical cyclone, separating the storm’s low-level circulation from its thunderstorms. When that happens, the storm can struggle to organize or intensify.
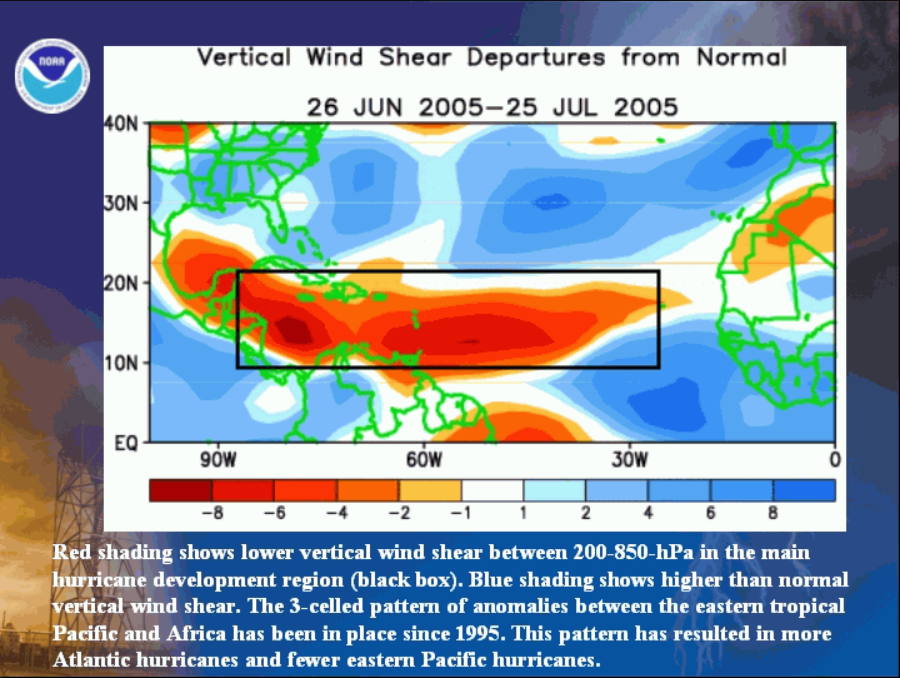
Weak shear allows thunderstorms to remain closer to the center of circulation, helping the storm become vertically aligned and organized. This was a key factor influencing the destructive path of the 2005 Atlantic hurricane season. This season had a tropical environment that was able to support tropical development very well, allowing disturbances moving across the Atlantic to maintain their organization instead of being dismantled by the upper-level winds. This helps explain why so many systems were able to transition from relatively disorganized disturbances into strong tropical storms and hurricanes as they approached the United States.
African Tropical Waves
Another critical ingredient was the supply of disturbances entering the Atlantic from Africa. Many of the Atlantic’s strongest hurricanes this year began as African tropical waves that move westward from Africa. These are elongated troughs of low pressure that move from east to west across North Africa and into the tropical Atlantic Ocean, occasionally producing tropical cyclones. These disturbances can contain areas of enhanced thunderstorm activity and vorticity that prime the initial area of interest for tropical cyclone development.
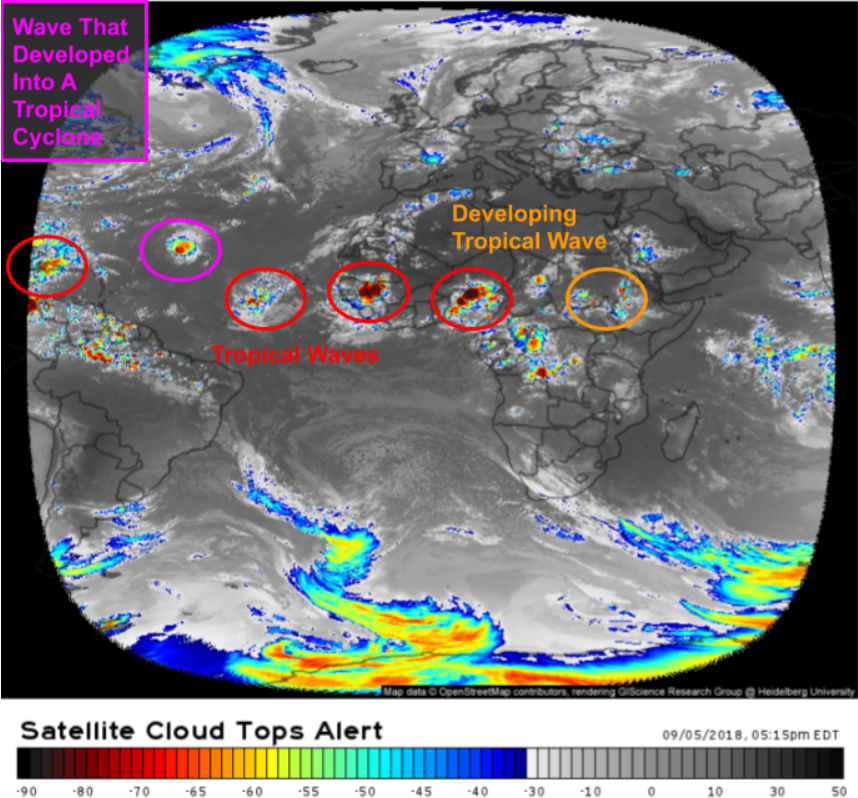
The West African monsoon also plays an important role in generating these waves. A stronger monsoon season produces more frequent and intense easterly waves (the same thing as tropical waves), increasing the number of disturbances and providing fuel for storms to develop. Rising air and heavy condensation from the monsoon also release latent heat energy, which helps spin up and sustain low-pressure spinning systems. In 2005, the Atlantic had both an abundant supply of disturbances and an environment capable of allowing those disturbances to develop.
What is important with this season is that you can have a very active African wave system entering an Atlantic dominated by strong wind shear and dry air and still see many of those systems fail. This demonstrates that in 2005, the disturbances had a favorable environment waiting for them out in the Atlantic that allowed further development of these tropical waves.
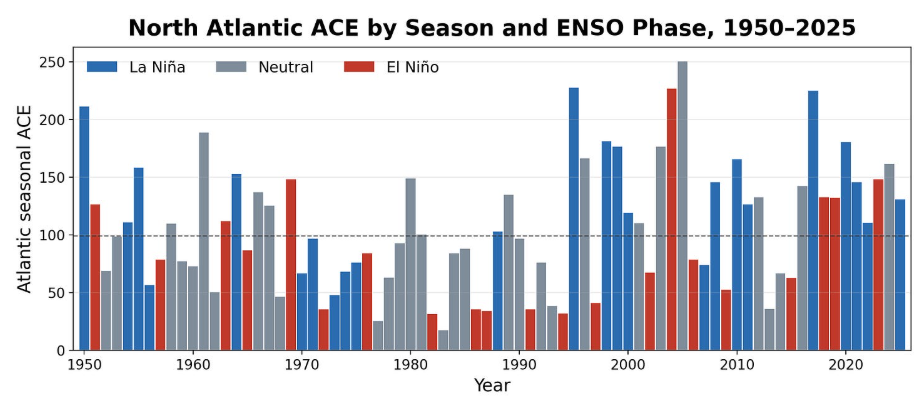
Neutral ENSO (El Nino Southern Oscillation)
The year 2005 started at a neutral El Niño season, which lowered the likelihood of storms making landfall on the East Coast of the United States and led to a concentration of impacts farther west and into the Gulf. During an El Niño year, Atlantic hurricane activity is usually suppressed, as we are seeing right now in the 2026 Atlantic season. El Niño typically produces stronger upper-level westerly winds over the tropical Atlantic, increasing vertical wind shear and making it more difficult for tropical cyclones to organize. The lack of a strong El Niño allowed the atmosphere over the Atlantic to remain favorable for tropical development throughout the season.
A Dangerous Mixture
The confluence of atmospheric and oceanic factors during the 2005 season was truly extraordinary, and the season’s unprecedented activity reflected just how favorable the environment had become. With warm ocean temperatures providing the energy, weak vertical wind shear allowing storms to organize, abundant moisture and atmospheric instability supporting deep convection, African tropical waves supplying disturbances, and a broad atmospheric pattern that did not suppress development, the Atlantic Basin became exceptionally conducive to hurricane formation and intensification.
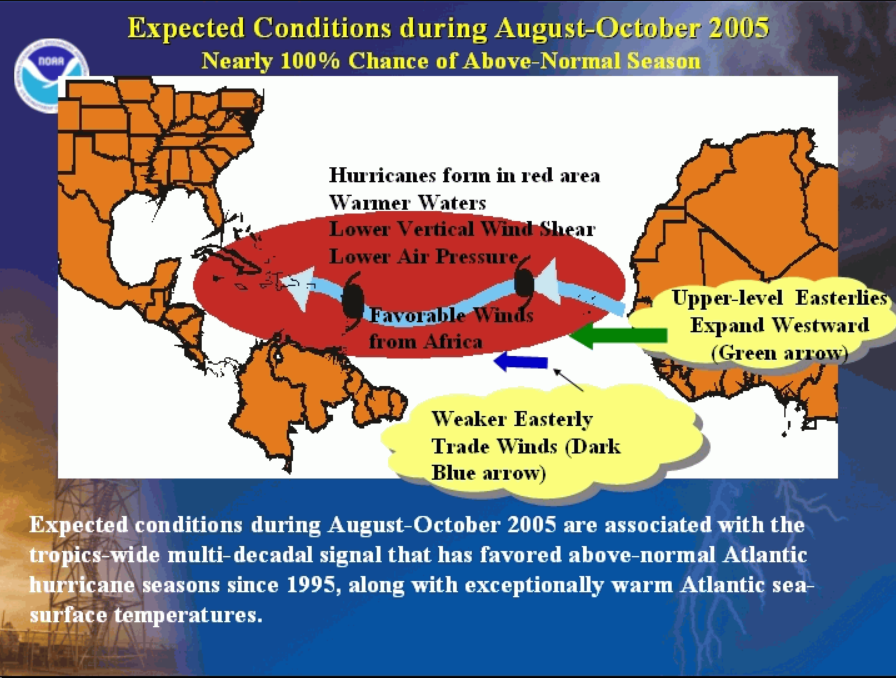
These environmental conditions resulted in an unprecedented number of storms. By the end of the season, it had produced 28 named storms, breaking the previous record of 21 established in 1933. Fifteen of those storms became hurricanes, while seven reached major hurricane status with sustained winds of at least 111 mph (178 km/h). Meteorologists exhausted the official naming list after Tropical Storm Wilma, forcing the National Hurricane Center to name additional storms using the Greek alphabet, beginning with Alpha. At the time, this had never occurred in the Atlantic Basin.
Another rather interesting fact about the 2005 season is that during the post-season re-analysis in April 2006, the National Hurricane Center discovered a previously unnoticed subtropical storm that formed on October 4, 2005. Since this storm was unnoticed while Hurricane Stan was impacting Central America at the time, it went unnamed. This storm was short-lived, forming on October 4th and becoming extratropical on October 5, 2005, before being absorbed by the non-tropical low that later spawned Hurricane Vince. There was no damage or casualties reported from this unnamed storm, although it did bring tropical storm-force winds to the Azores archipelago, which is a cluster of Portuguese islands in the northeastern Atlantic Ocean.
Extreme Intensification
The favorable environment did not just produce a large number of storms, it also allowed these storms to strengthen at extraordinary rates. Rapid intensification occurs when a tropical cyclone’s maximum sustained winds increase dramatically over a short period of time. One of the most famous examples of this is Hurricane Wilma, which still holds the record today for the lowest central pressure ever observed in an Atlantic hurricane. During its explosive strengthening phase, Wilma’s central pressure plunged from 982 mb to a record-low 882 mb in just 24 hours, while its maximum sustained winds increased to 185 mph, making it one of the most intense hurricanes ever recorded in the Atlantic.
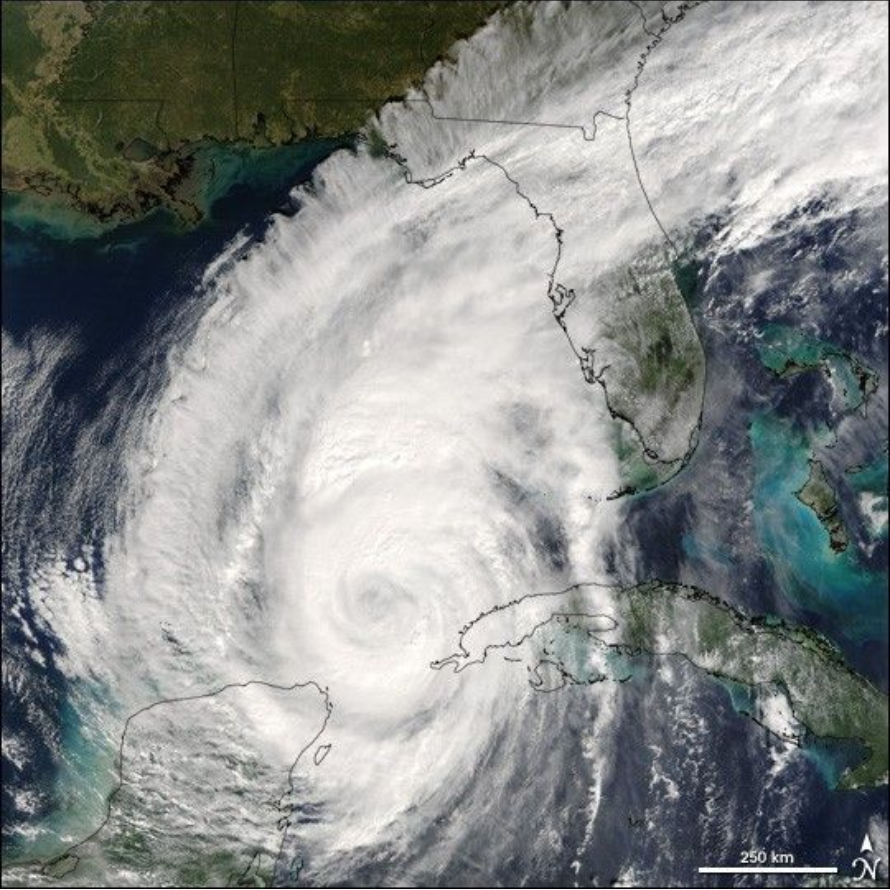
Wilma, having intensified from a Tropical Storm into a Category 5 hurricane in less than 24 hours, was one of the most extreme examples of rapid intensification during the 2005 season. However, Wilma was not the only storm to undergo explosive strengthening. Hurricanes Dennis, Emily, Katrina, and Rita also experienced periods of rapid intensification, demonstrating that extreme strengthening was a recurring feature of the 2005 season rather than an isolated event.
The Human Cost
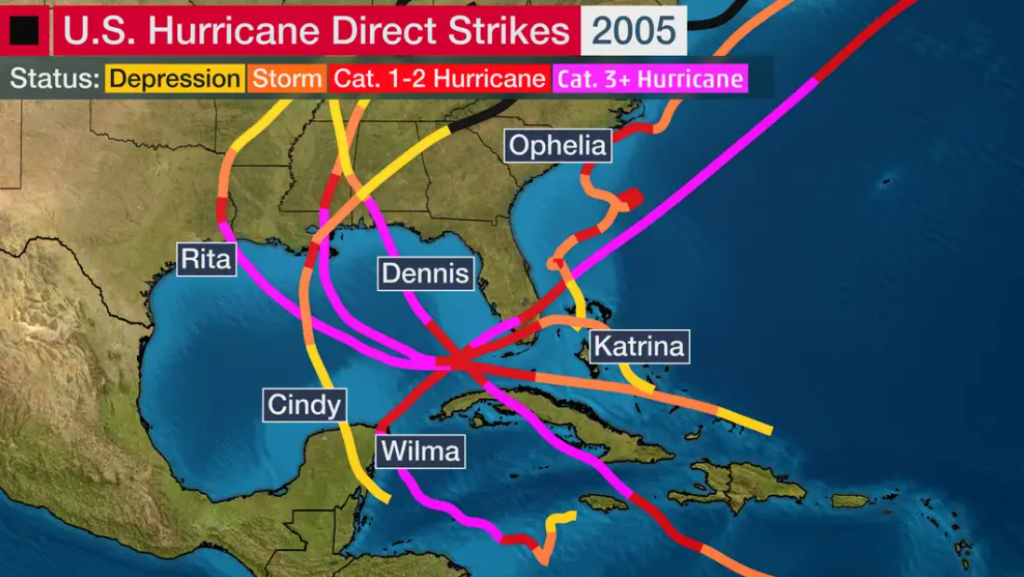
The statistics demonstrate how active the season was, but they do not explain why 2005 remains so deeply remembered. Hurricanes and tropical storms affected millions of people in communities across the Caribbean, Central America, Mexico, and the United States, causing catastrophic storm surge, flooding, wind damage, and widespread infrastructure failures. The season’s historic four major U.S. hurricane landfalls placed enormous strain on emergency management and coastal communities, while evacuations displaced hundreds of thousands of people.
Hurricane Katrina became one of the most devastating examples, with catastrophic flooding across the New Orleans area after portions of the city’s flood-protection system failed. The flooding displaced hundreds of thousands of people and caused enormous economic and social disruption. However, the season’s damage extended far beyond one storm. Rita struck the Gulf Coast only weeks after Katrina, impacting an already struggling community. Across the Atlantic basin, the season resulted in hundreds of deaths and massive destruction across North and Central America.
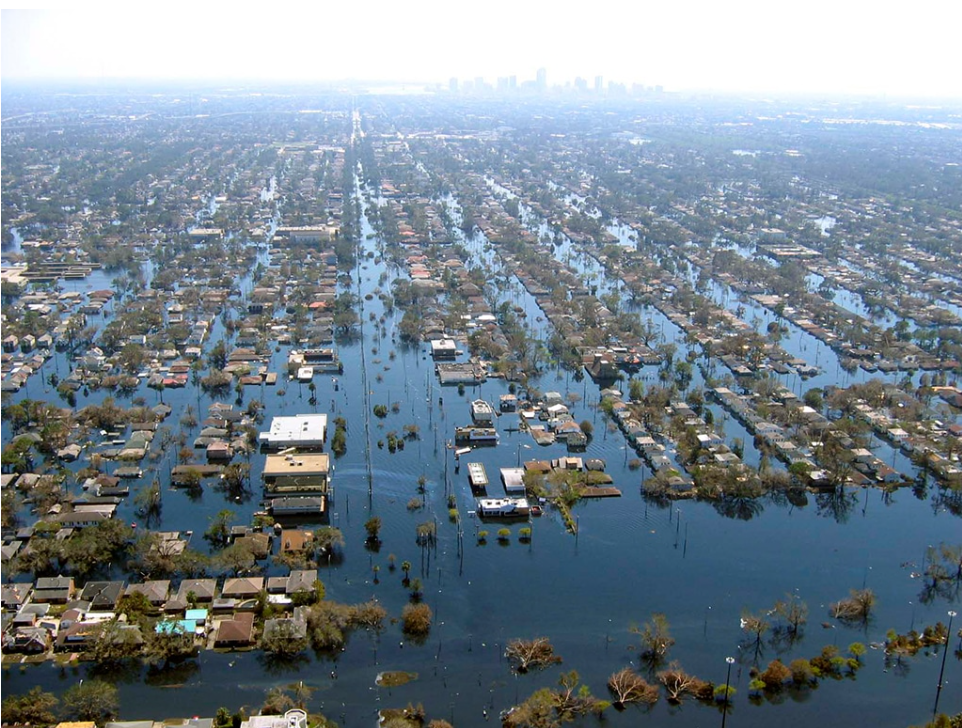
The economic consequences were equally staggering, with approximately $161 billion in U.S. damage, making 2005 the costliest U.S. hurricane season on record at the time. Ultimately, the human toll of 2005 demonstrated that the danger of hurricanes extends far beyond wind speed. Storm surge, rainfall, flooding, infrastructure vulnerability, and the ability of communities to prepare and respond can determine the true severity of a disaster. In this way, 2005 became an important lesson for emergency management officials as much as it was for meteorology.
EDITOR’S NOTE: For more information on the Southern MS/AL/LA impacts, check out this video put together by Nick: https://youtu.be/GVgTe72wdPQ?si=Tv16iFI1VV87GP4d
What Did ’05 Teach Meteorologists
The 2005 season exposed many flaws and issues with tropical forecasting. One of the biggest was the previously discussed rapid intensification. Several storms strengthened dramatically over relatively short periods, demonstrating how difficult it can be to predict when a tropical cyclone will suddenly intensify. Even now, extreme, rapid intensification remains one of the most difficult concepts when forecasting tropical systems.
The season also reinforced the importance of communicating impacts rather than simply categories or the strength of a storm. An example of this would be Hurricane Cindy, which was only a Category 1 at landfall, but still significantly impacted coastal Louisiana, producing historic flooding and tornadoes that damaged the New Orleans area just weeks before Katrina. Tropical Storm Matthew is another example. This storm made landfall in Louisiana and contributed to heavy rainfall and flooding, despite being a relatively weak storm and not even a recognized hurricane. One of the biggest lessons of the ’05 season for meteorologists and emergency management officials is that impact is not always proportional to category.
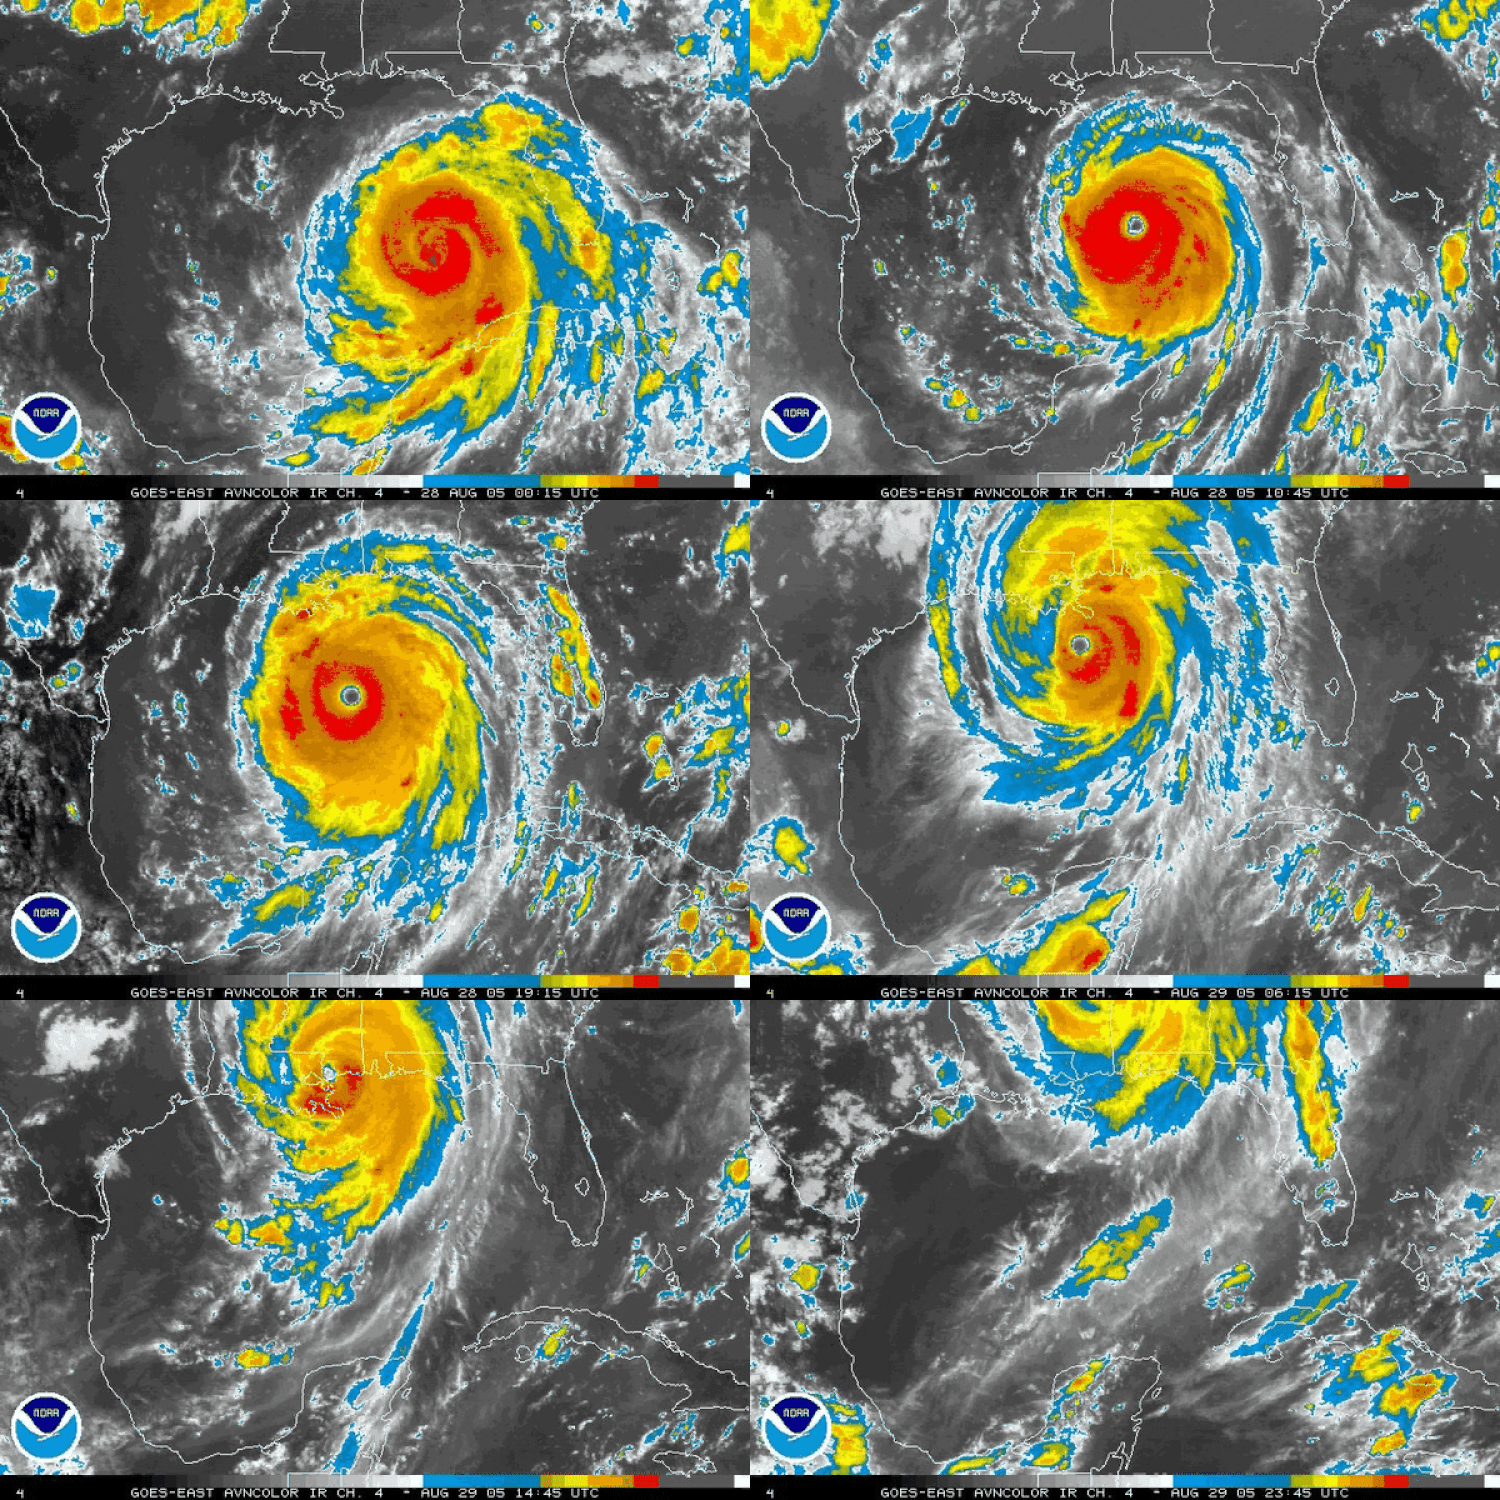
The 2005 hurricane season had a major impact on emergency management, especially because Katrina exposed serious weaknesses in how large-scale disasters were planned and responded to. Katrina demonstrated that preparing for a hurricane meant more than just forecasting the storm and ordering an evacuation. Emergency management had to account for transportation, sheltering, communication, infrastructure failures, and the needs of vulnerable populations. The failures exposed during Katrina prompted major changes in disaster-response planning and emphasized the importance of coordination between local, state, and federal agencies.
The Legacy of 2005
Twenty-one years later, the season remains one of the most fascinating case studies in tropical meteorology. The key lessons from 2005 are that an extreme hurricane season does not come from one ingredient alone. The Atlantic needs disturbances to develop, warm water to provide energy, an atmosphere capable of supporting organization, and large-scale circulation patterns that allow storms to thrive. In 2005, those pieces came together in an extraordinary and unfortunate way.
2005 showed us that the most dangerous hurricane seasons are not necessarily defined by one catastrophic storm. They can emerge when the atmosphere and ocean remain favorable long enough for storm after storm to take advantage of the same environment. This storm season in particular remains a solemn reminder of the power of the atmosphere, especially when multiple factors combine to create such intense phenomena. At the same time, 2005 serves as a benchmark for just how far tropical forecasting has advanced, from improvements in satellite observations and numerical weather prediction, to storm surge modeling and rapid-intensification forecasting. The lessons of 2005 continue to shape how meteorologists understand, forecast, and communicate tropical cyclone threats today, making the season not only a reminder of what hurricanes can do, but of how much we can learn from them.
Works Cited
“Mariners Weather Log Vol. 50, No. 2, August 2006.” Noaa.Gov, 2023, https://www.vos.noaa.gov/MWL/aug_06/atl_hurricane_season_2005.shtml. Accessed 12 Aug. 2026.
2005 Atlantic Hurricane Season. (n.d.). In www.nhc.noaa.gov. Retrieved August 12, 2026, from https://www.nhc.noaa.gov/data/tcr/index.php?season=2005&basin=atl
The 2005 Atlantic Hurricane Season, Fifteen Years Later. (2025). In National Environmental Satellite, Data, and Information Service. https://www.nesdis.noaa.gov/news/the-2005-atlantic-hurricane-season-fifteen-years-later?utm
Atlantic Hurricane season – Neutral ENSO: How does this impact hurricanes? (2025). In Weather & Radar. https://www.weatherandradar.com/weather-news/atlantic-hurricane-season-neutral-enso-how-does-this-impact-hurricanes–9266ab44-9ffb-4cc7-b31f-e46b7396d359
Beven, J. L., Avila, L. A., Blake, E. S., Brown, D. P., Franklin, J. L., Knabb, R. D., Pasch, R. J., Rhome, J. R., & Stewart, S. R. (2008). Atlantic Hurricane Season of 2005. Monthly Weather Review, 136(3), 1109–1173. https://doi.org/10.1175/2007mwr2074.1
National Weather Service. (2005). Hurricane Katrina – August 2005. In National Weather Service. National Weather Service. https://www.weather.gov/mob/katrina
Beven, J. L., and Coauthors, 2008: Atlantic Hurricane Season of 2005. Mon. Wea. Rev., 136, 1109–1173, https://doi.org/10.1175/2007MWR2074.1.
Climate Prediction Center – Expert Assessments: Atlantic Hurricane Outlook Update. (2026). Noaa.Gov. https://www.cpc.ncep.noaa.gov/products/outlooks/hurricane2005/August/hurricane.html
El Niño Means Fewer Atlantic Hurricanes—but More Activity Worldwide | American Enterprise Institute – AEI. (2026, July 27). American Enterprise Institute – AEI. https://www.aei.org/commentary/el-nino-means-fewer-atlantic-hurricanes-but-more-activity-worldwide/


