Introduction
Hello, and welcome back to my third and final research project this summer! For my previous two research projects, I covered topics related to drought and dry soil, so I thought I would switch it up and do the exact opposite, flash floods. In this project, I intend to review three historical flash flood events that have occurred along the gulf coast.
One of the most obvious reasons that the deep south experiences so much flash flooding is because of its proximity to the Gulf of Mexico. The Gulf of Mexico is a very warm body of water; during the summertime months, sea surface temperatures frequently top 90ºF, making it feel more like a hot tub than the ocean. This warm water then evaporates, causing the air above it to become very humid, which results in nearly daily thunderstorm development during the summer months in the deep south. However, even during the spring and winter months, flash flood events have occurred and been aided by warm gulf waters. All three flash flood events that I analyzed were caused by a low pressure system or front that stalled over the area, continuously drawing in gulf moisture for days on end.
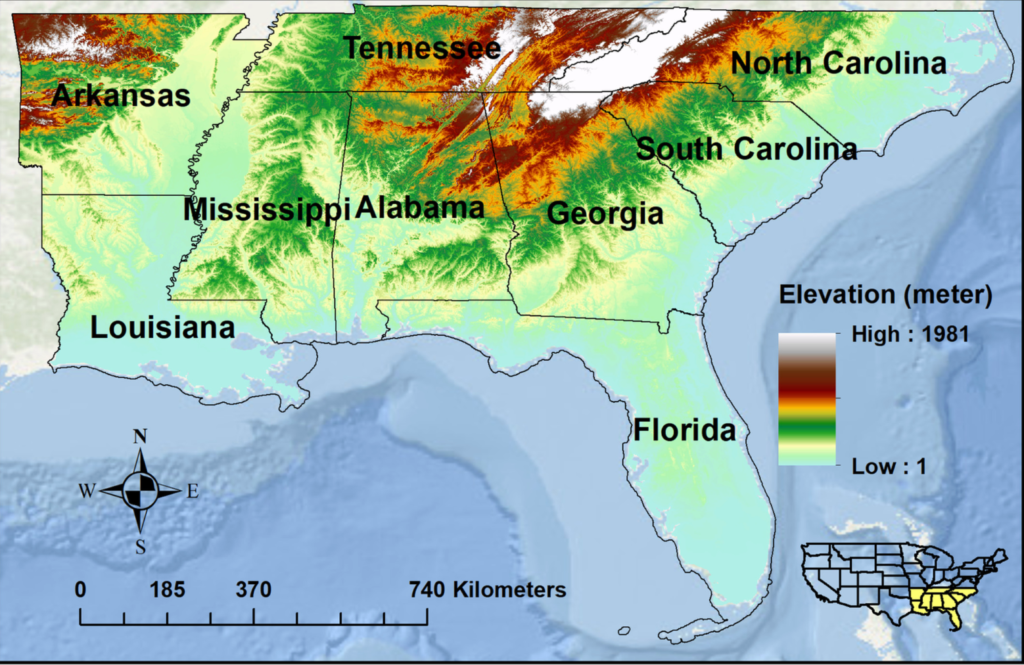
One slightly less obvious reason for frequent flash floods is the terrain of the deep south. Florida and Louisiana have the second and third lowest average elevation respectively of all 50 states in the United States. Many other areas along the gulf coast in other states have very low elevations as well. When heavy rain for an extended period of time occurs, not only does the low elevation land flood easily, those same areas get runoff water from higher elevations. This can lead to catastrophic flooding. Finally, many parts of the deep south, especially Louisiana, have abundant clay in their soil. This can lead to worse flooding as clay is packed together very tightly, making it extremely difficult for water on the surface to percolate through. All three of these important factors played a role in the severity of the flash flood events I analyzed.
May 1995 Louisiana/Mississippi Flash Floods
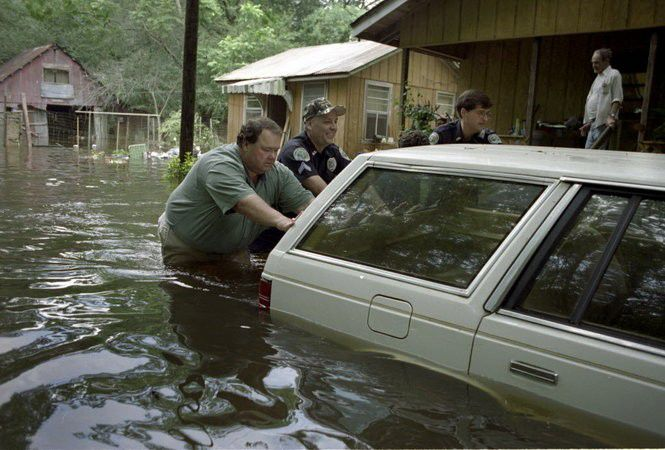
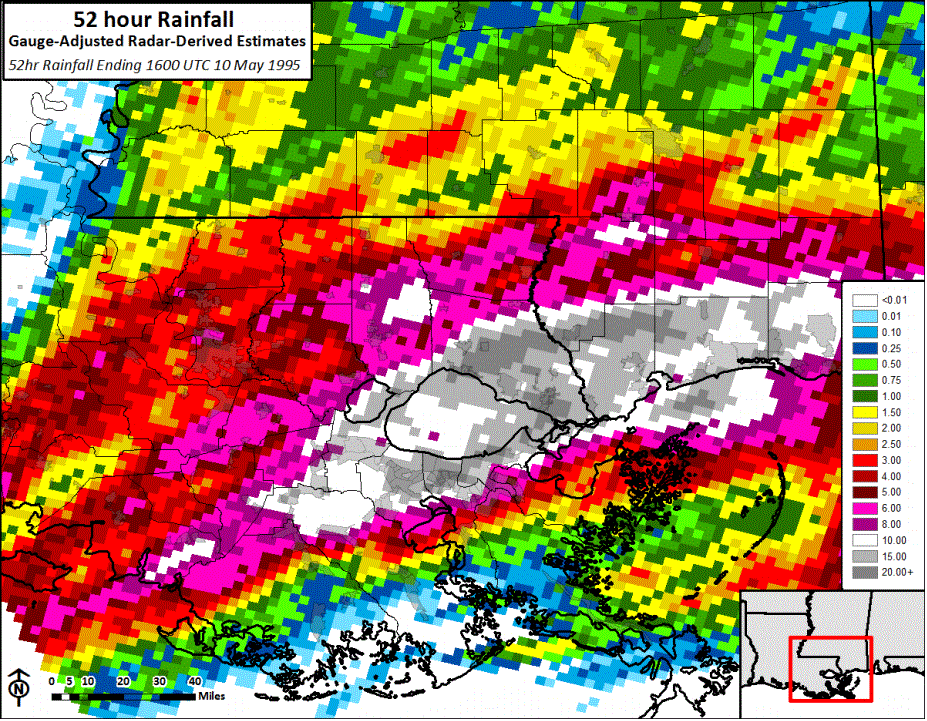
If you were in New Orleans or the surrounding area in May of 1995, you’ll certainly remember the floods that occurred that month. The May 8-10, 1995 floods were caused by two waves of extremely heavy rain, one on the night of May 8th, and one the following night on May 9th. By midday on May 10th, obscene 40 hour rainfall totals were observed in southeastern Louisiana and surrounding areas. In New Orleans, it was the worst rainfall only flood in their history. The highest rainfall total came in Necaise, Mississippi, a town in Hancock county which picked up 27.50” of rain. Some parts of New Orleans received more than 2 feet of rain. This event is also believed to have set a statewide record in the state of Mississippi for hourly rainfall, with nearly six inches of rain pouring down in a single hour on the morning of May 9th. In general, the highest rainfall totals were observed between Lake Pontchartrain and the far eastern parts of the Mississippi gulf coast.
Atmospheric Setup and Meteorological Timeline:
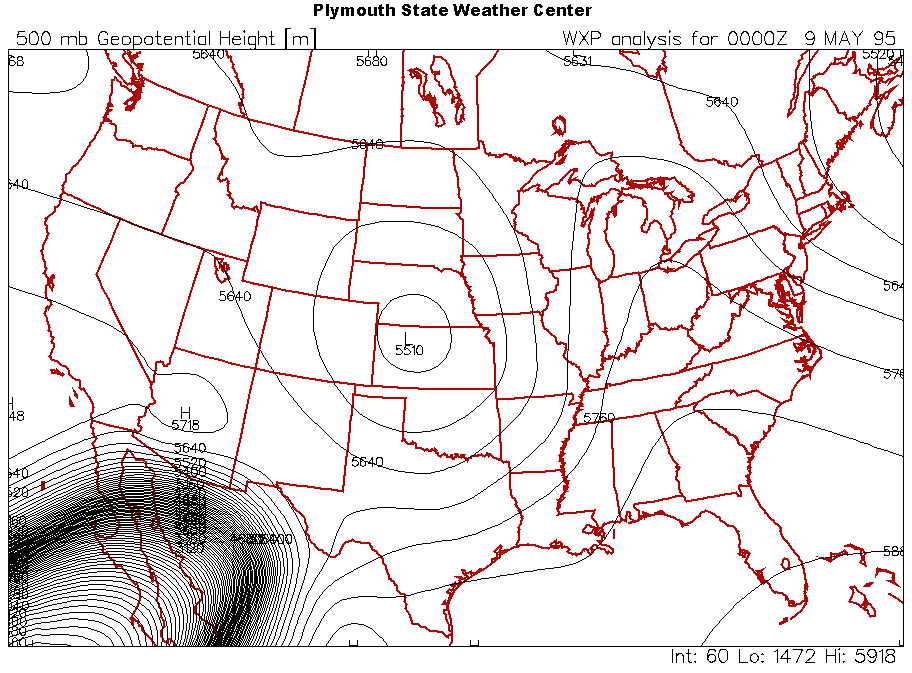
The large-scale setup that led to the flooding involved a potent area of low pressure situated over the great plains as well as a ridge situated over the Caribbean which extended all the way up into the great lakes region. The actual cause of the flooding was a stalled stationary front which lingered over southeastern Louisiana and southern Mississippi from May 8-10. Fronts are the boundaries between two air masses, and in this case the front was between the low pressure center over the great plains and high pressure center over the Caribbean. Since cool and moist air (low pressure) is less dense than warm and dry air (high pressure), the warm and dry air sinks underneath the cool and moist air and forces that air to rise. This causes the moist air to condense and turn into precipitation. During this event, this exact thing happened to the extreme. There was also plenty of moisture provided by the nearby Gulf of Mexico.
On May 8th, the stationary front moved in and stalled slightly to the east of Baton Rouge, not directly over New Orleans. The main culprit for the heavy rain in New Orleans was a pre-frontal trough extending from Lake Pontchartrain to west of New Orleans. The location of the trough aligned with the region where divergence aloft was greatest, or in other words, where the greatest amount of warm and moist air was rising and spreading out. Combined with the fact that soundings indicated that the air was extremely unstable (warm and moist, so it rises) at the surface, atmospheric conditions for a prolific rain event were nearly perfect. By the early morning hours of May 9th, the air in the trough was saturated up to a very high height, and after that the skies opened up. By the early afternoon of the 9th, the atmosphere became more stable and the rainfall stopped. During the late night hours of the 9th, a pocket of cold air was advected in the upper atmosphere above the same places that flooded, causing the temperature contrast between the lower and upper atmosphere to increase, leading to more instability. That night, the New Orleans area got a second round of heavy rain, except this time the atmospheric setup was even more efficient at producing rain.
Impacts and Aftermath:
When it was all said and done, the New Orleans and Mississippi gulf coast areas were left inundated and devastated. Tragically, 7 lives were lost. 44,500 homes and businesses were damaged, and $3.1 billion in insurance claims were accounted for across the 11 parishes/counties that were declared disaster areas. Of that $3.1 billion, $360 million was in the city of New Orleans. It was the costliest single non-tropical weather disaster in the United States during the 20th century, and the single costliest non-tropical weather disaster ever recorded in the United States at the time.
In the wake of the floods, the Southeast Louisiana Urban Flood Control Project (SELA) was authorized by congress in 1996. The main goal of the project was to improve pumping stations and widen and deepen underground drainage canals to handle rainfall events where up to 9” of rain falls in a single day. After Hurricane Katrina, congress authorized the project to be 100% federally funded to speed up progress. The project is still not fully completed to this day.
August 2016 Louisiana Floods
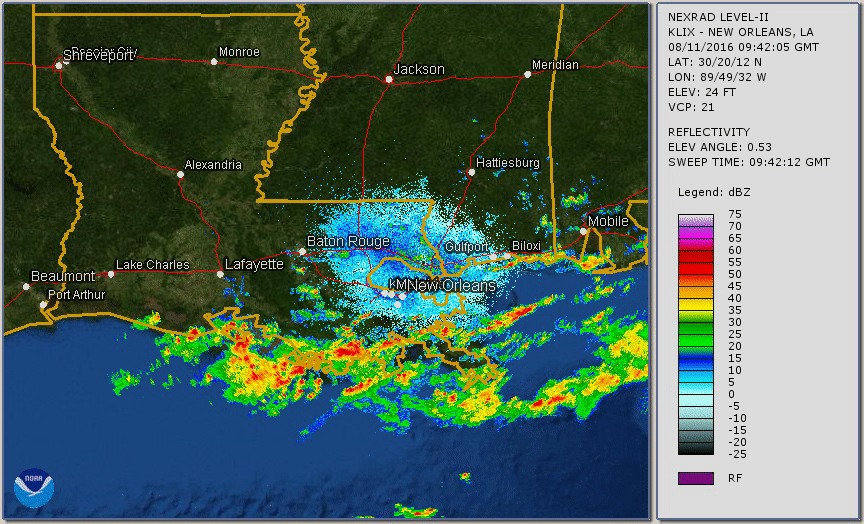
From August 11-15, 2016, it didn’t stop raining in southeastern Louisiana. In what was described to be a 1 in 1000 year weather event, an unnamed low pressure system dumped 7.1 trillion gallons of water on the state of Louisiana. This amount of water was three times the amount of rain hurricane Katrina dropped on Louisiana, and was enough to fill Lake Pontchartrain roughly four times.
Atmospheric Setup and Meteorological Timeline:
Around August 9th, a low pressure center began to develop near the Florida panhandle and scattered thunderstorms formed across Louisiana. Over the next couple of days, the storms and the low pressure center amplified each other, drawing in tons and tons of moisture. Severe flooding began on August 11th, when parts of Louisiana and Mississippi received more than six inches of rain. August 12th was the worst day of the event, with Baton Rouge receiving nearly a foot of rainfall on that day alone, 11.24” to be exact. However, compared to some other places to the northeast out in Livingston, Saint Helena, and Tangipahoa parishes, the totals in Baton Rouge weren’t as impressive. In Livingston parish, one official stated that an estimated 75% of homes were a “total loss”.
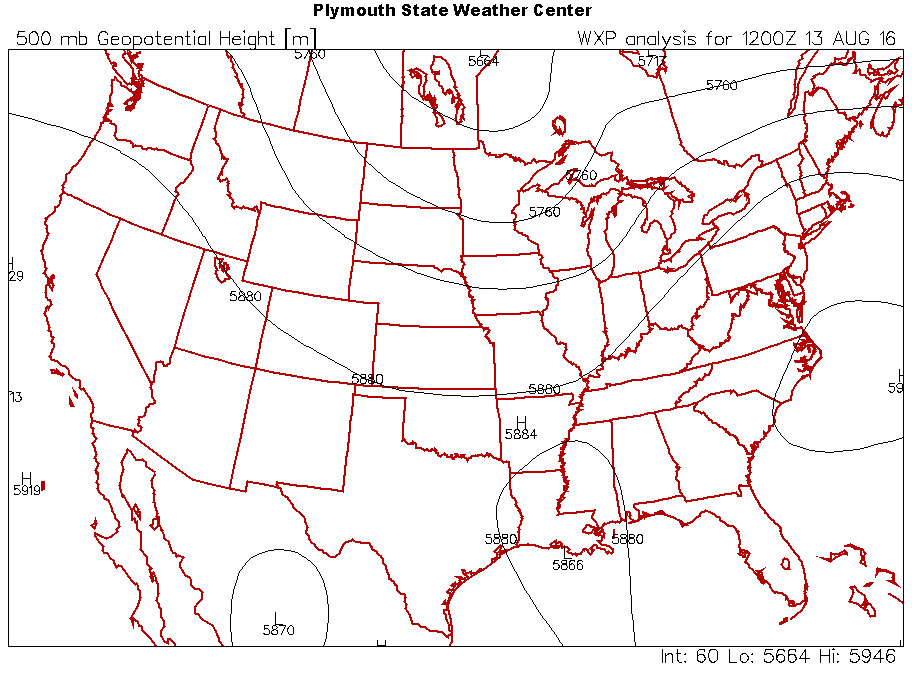
The large-scale atmospheric setup that led to the floods was quite unusual. It involved a highly abnormal non-tropical area of low pressure in the Gulf of Mexico that formed over land. This is a big reason why the system never got named by the National Hurricane Center even though it had a few tropical characteristics such as counterclockwise flow at its center. The setup also involved an upper-level trough originating from the western United States which dipped down far enough to interact with the low pressure center in the gulf as well as a ridge off the coast of the Carolinas. The trough and ridge setup kept the low pressure center in Louisiana nearly stationary for multiple days on end.
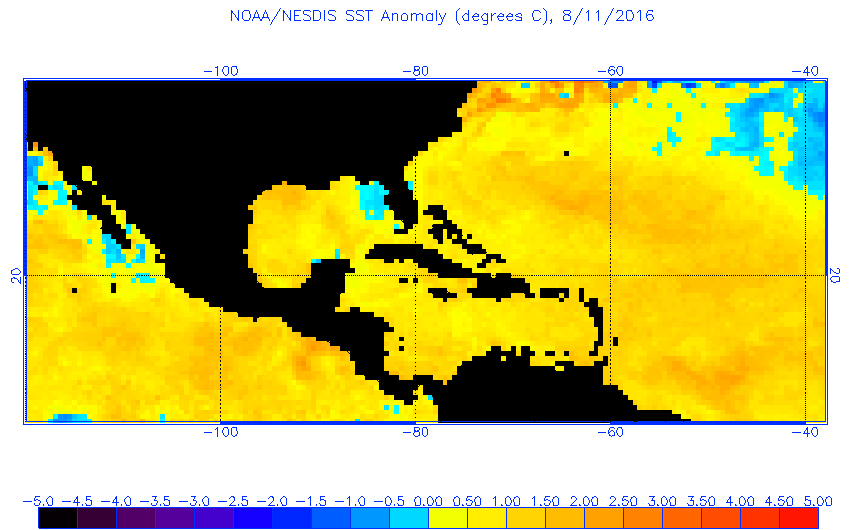
There were a few other factors that led to the record flooding observed. I mentioned before that Louisiana and the surrounding areas are among the most vulnerable places for flooding in the country. This is partially due to the body of bathwater which sits to its south known as the Gulf of Mexico. The gulf acts as an unlimited source of energy for huge rainmakers. By August of 2016, the water off the coast of Louisiana was significantly warmer than average, which contributed to near record high atmospheric precipitable water values in Louisiana leading up to the event.
Impacts and Aftermath:
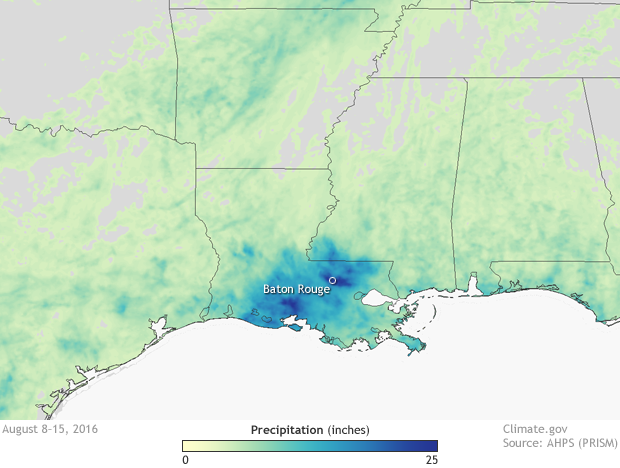
As you could probably imagine, rainfall totals were copious. A maximum accumulation of 31.39” was recorded in Watson, LA for the entire event. In Baton Rouge, 19” fell and in the Lafayette area, 17-21” fell. New Orleans escaped the brunt of the storm, picking up between 1 and 3” of rain. During and after the event, as many as eight rivers in the area reached their record flood stage. This included the Amite and Comite rivers, which crested at 6.5 and 4 feet above their previous all-time records.
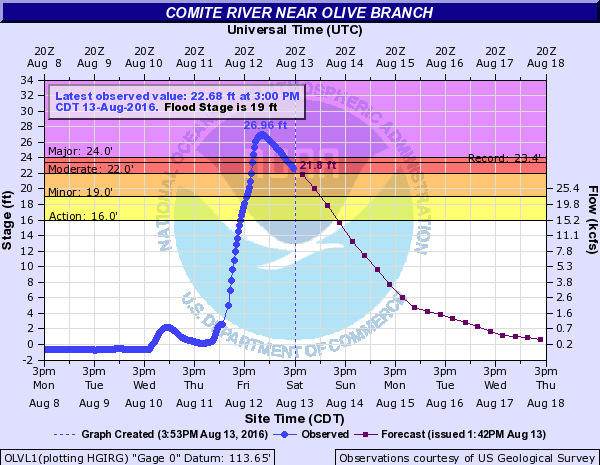
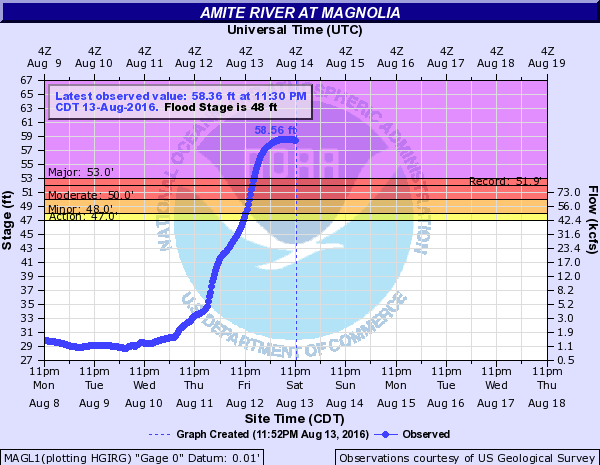
In total, thirteen lives were lost, and $10-15 billion in damage occurred during the event, making it the costliest weather disaster of 2016 in the United States, and the second costliest weather event in Louisiana’s history. In the aftermath of the disaster, 12 parishes in Louisiana were declared disaster areas. After having received $1.7 billion in federal grant money, the Restore Louisiana program demolished and fixed more than 17,000 homes. Some improvements to the state’s infrastructure were made as well, with drainage gaps being cut into concrete barriers along I-12 as the lack of them left thousands of people on the interstate stranded for hours during the flood.
Hurricane Harvey (2017)
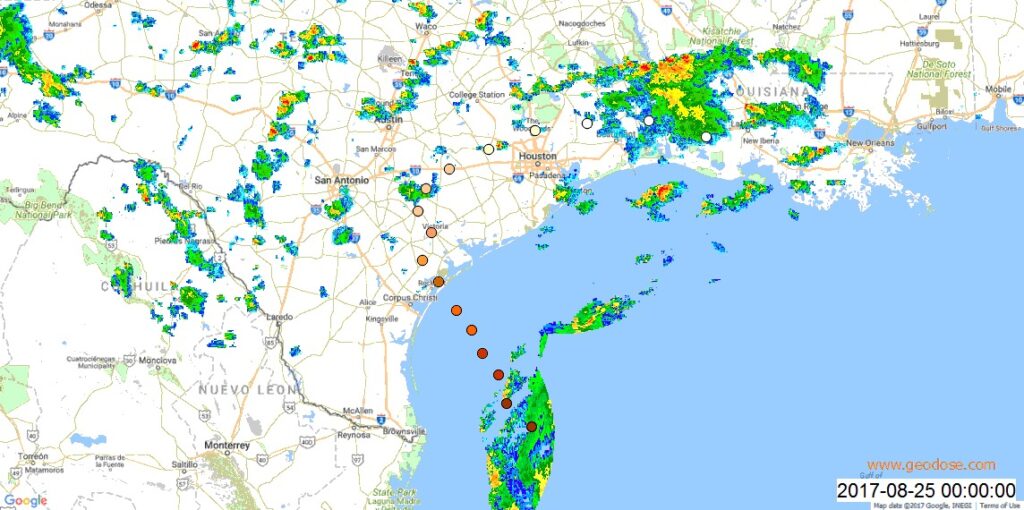
Now for the mother of all flash floods, Hurricane Harvey. What would become Hurricane Harvey originated as a westward moving tropical wave from Africa. On August 18th, after crossing the Atlantic, the wave strengthened into tropical storm Harvey and made landfall on the islands of St. Vincent and Barbados as a weak tropical storm. The next day it degenerated back into a tropical wave. Four days later on August 23rd, Harvey entered the gulf of Mexico and re-intensified into a tropical cyclone. Harvey then entered a highly favorable environment and rapidly intensified into a hurricane the next day, and then into a category 4 hurricane later that night. That night, Harvey made landfall in Rockport, TX at its peak intensity of 130 mph with a central pressure of 937 mb. The wind damage due to Hurricane Harvey was severe in and around Rockport, but the real story was the flooding. Over the next few days, Harvey would come to a crawl over Texas, delivering catastrophic flash flooding to many parts of southeastern Texas and western Louisiana. From August 25-30, parts of southeastern Texas were hit with a near constant stream of 1-3″ per hour (sometimes more) rainfall from the outer bands of Hurricane Harvey.
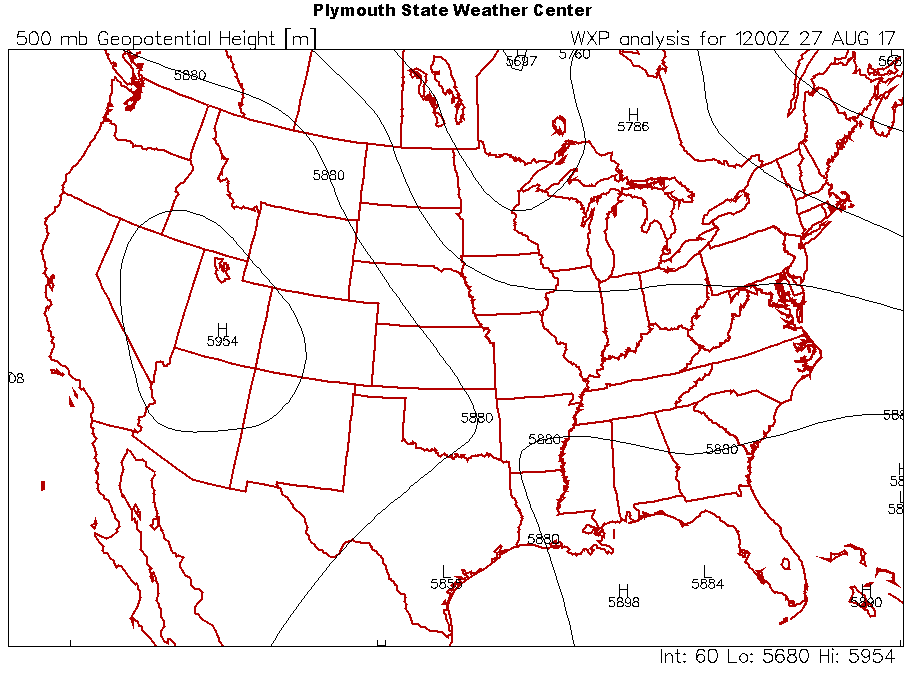
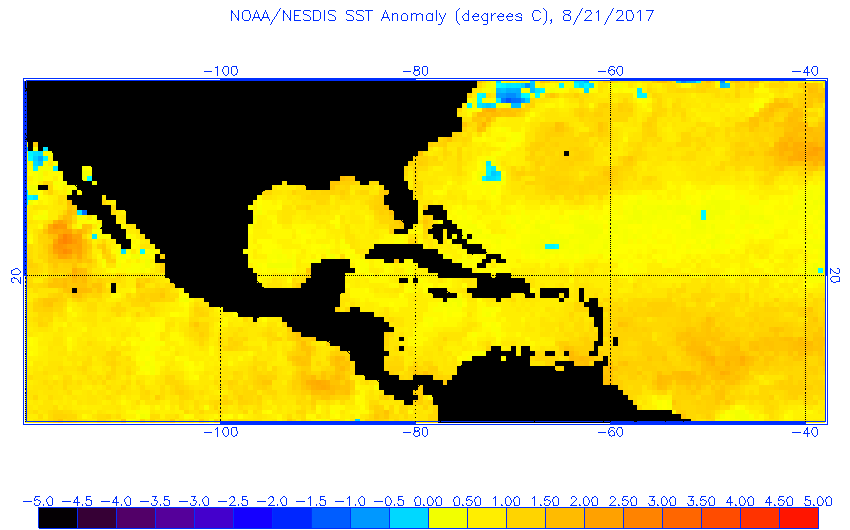
Let’s take a look at the large-scale atmospheric patterns that caused Harvey to linger for such a long time. After Harvey made landfall as a category 4 hurricane, it got stuck in between two ridges of high pressure. One was over the southwest and the other was over the northeastern gulf of Mexico. Harvey, being stuck in between both of them, had nowhere to go, so it lingered over Texas and slightly off the coast for many days. Generally, this was the reason why the flooding was so catastrophic. Like the previous two flash flood events that were discussed, the warm waters of the Gulf of Mexico also played a significant role. Leading up to Harvey, sea surface temperatures were above normal in the gulf, which certainly aided Harvey in its rapid intensification right before it made landfall. The warm sea surface temperatures also helped intensify the outer bands of Harvey even after it made landfall and weakened back into a tropical storm. During the 4 day period where Harvey lingered, the outer bands that produced so much rain intensified over the ocean soon before coming on shore. This acted as a highly efficient mechanism for rain delivery in the hardest hit areas.
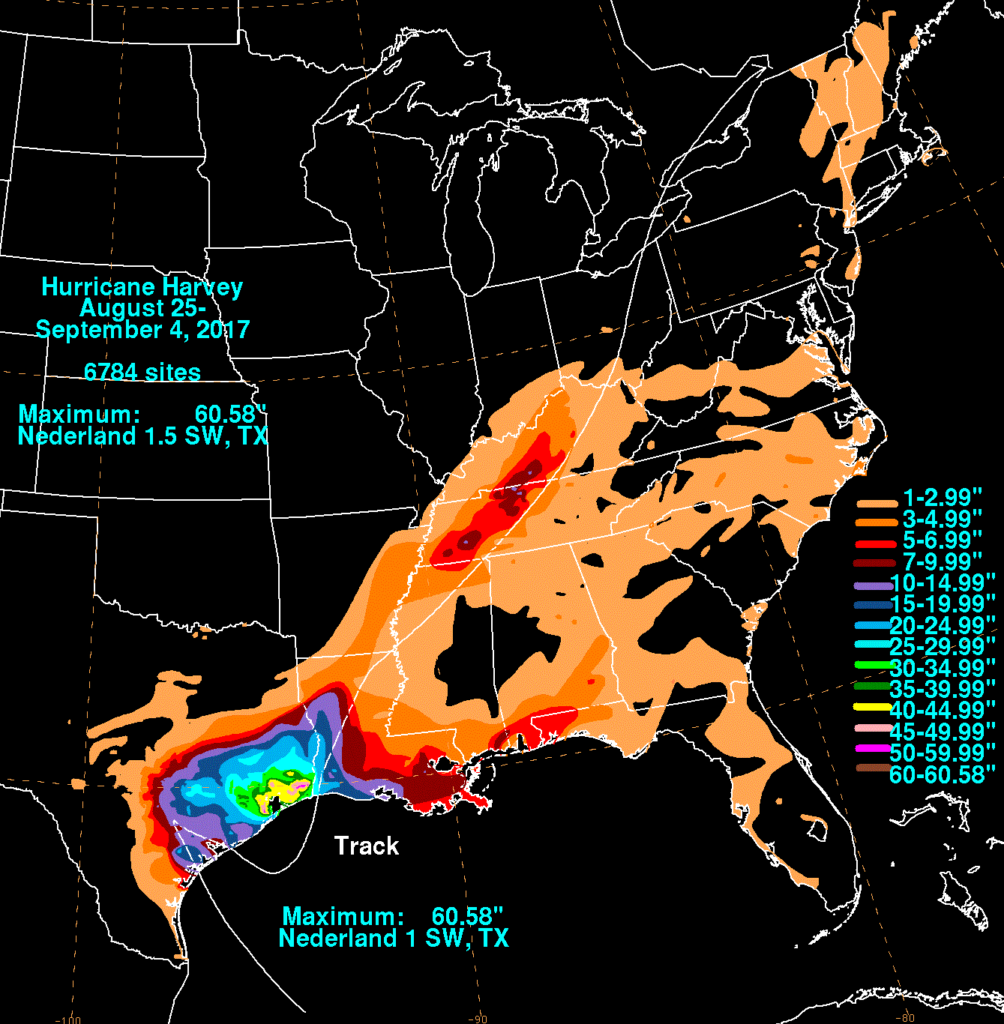
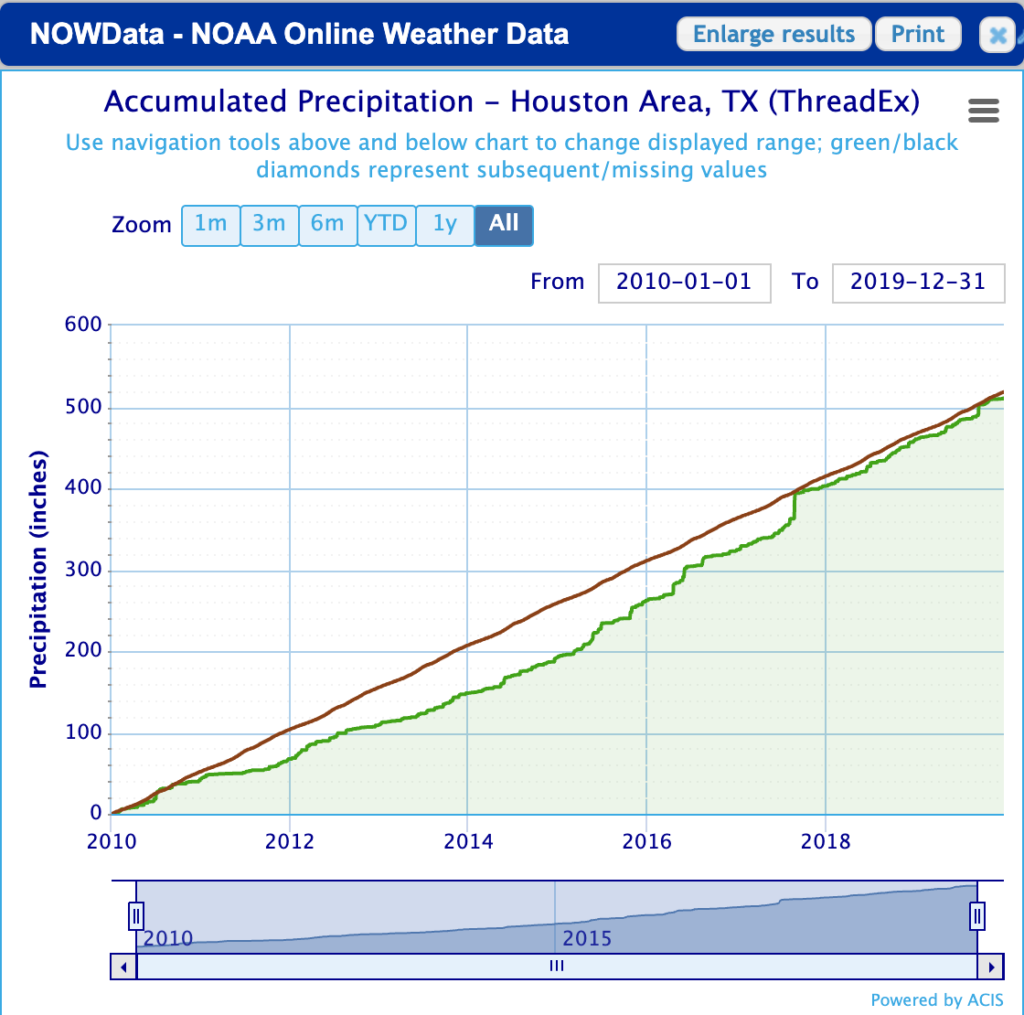
Due to the fact that Harvey’s outer bands were mostly to the northeast of its center, and the fact that the center stayed to the east of the densely populated Houston metro area, the highest rainfall totals were observed in the Houston area and slightly to the east. This was a worse case scenario situation, as Harvey’s impacts would not have been as severe had its outer bands been further to the east or southwest in less densely populated areas. When the rains finally abated, an incredible 60.58” of rain had fallen in Nederland, TX, which is in Jefferson county. Not only did it set a statewide record for the most amount of precipitation to fall in a single weather event, it also set a record for the entire country. At Houston Hobby airport, 35.60” of rain fell in total, which is 65% of their annual average precipitation. So much rain fell in Houston that in just 4 days, more rain fell at Hobby airport than for the entire calendar year of 2011, their driest calendar year on record. Just before Harvey began its multi-day trek across Texas, the 2010s decade was running about 30” drier than normal in Houston, mostly due to drought in the early 2010s. In just 4 days, the 7 year rainfall deficit was completely wiped away. On an accumulation graph, the rain from Harvey is very noticeable, with a visible spike occurring in 2017.
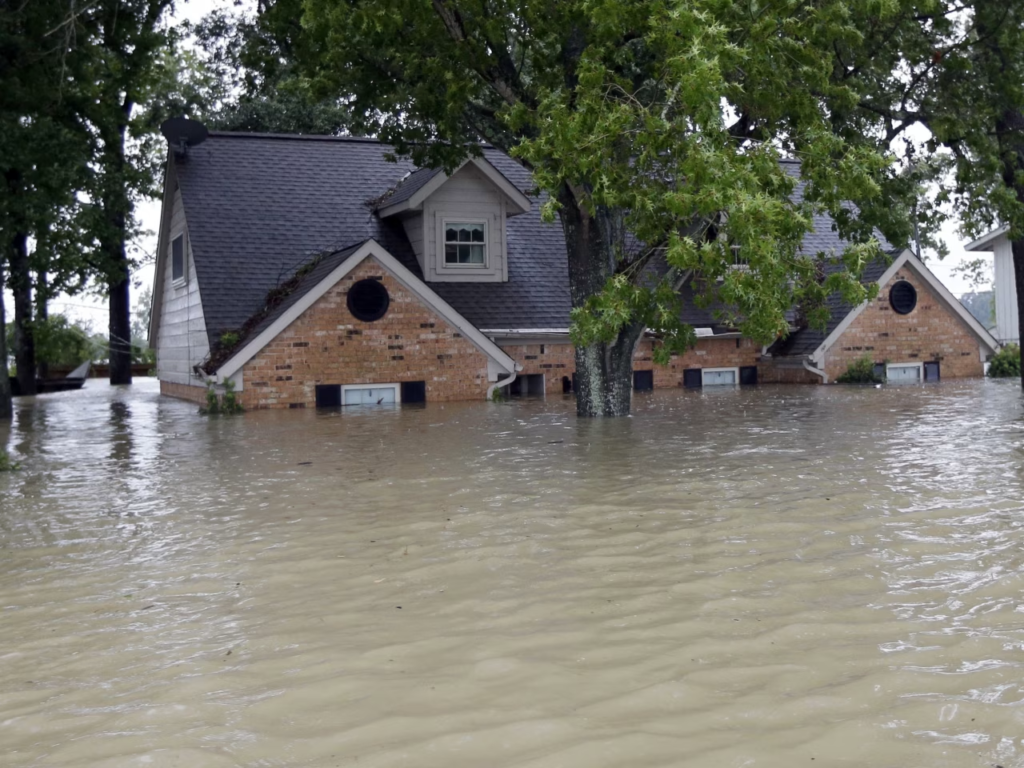
The total monetary damages associated with Hurricane Harvey was $125 billion, tying it with Hurricane Katrina as the costliest tropical cyclone in United States history. Although, accounting for inflation, it was the second costliest behind Katrina. Harvey was the costliest natural disaster in Texas history until February 2021. In Texas alone, 300,000 structures and 500,000 vehicles were damaged and destroyed. Sadly, 107 people lost their lives due to Harvey, 103 of which were in Texas. The Houston area is particularly problematic when it comes to floods and flood prevention for a few different reasons. Houston and southeastern Texas, similar to Louisiana, are very low in elevation. This is obviously a major issue since excessive rainfall events like Harvey produce so much rain that the water has nowhere else to go. The Houston area is also rapidly growing in terms of population. In the wake of Harvey, the Houston city council did approve a few new regulations, but many other proposed ones were ignored. This resulted in many homes being built in flood plains and wetlands, which both act as places for excessive water to go, being paved over. Should another Harvey like event occur in the future, is Houston doomed to make the same mistakes over again?
Discussion/Final Thoughts
Each one of these major flash floods has one thing in common with each other: an atmospheric setup which forces a low pressure center or stationary front to linger over one area for days on end all while drawing in abundant gulf moisture. During the May 1995 floods, a consistent trough over the great plains and a consistent ridge over the Caribbean forced a stationary front to linger over Louisiana for 3 days, all while moist air was advected into the low pressure system. The August 2016 floods involved a highly unusual non-tropical low pressure system in the Gulf of Mexico which was slowed down by interactions with a trough coming out of the western U.S. and was able to draw up tons of moisture due to very warm sea surface temperatures. During Harvey, two ridges adjacent to the hurricane forced the storm to linger over Texas for nearly a week while its northwestward moving outer bands were able to intensify over the gulf and deliver catastrophic flooding to Houston.
It’s pretty easy to see how climate change will increase the chances and severity of flash flood events in this region. The warmer the waters are in the gulf of Mexico, the higher the humidity will be in the most flood prone areas of the south. As the desert southwest becomes hotter, strong ridges of high pressure will become more frequent and resilient, preventing low pressure systems in the gulf of Mexico from travelling westwards and sparing the southeast from days of heavy precipitation. As disasters like these become more common, I hope that interest grows not only in successfully finding the link between the warming climate and the potential impacts disasters like these ones can have, but also in how to improve our infrastructure to help mitigate the harm that these disasters do to human life and wildlife.
Sources
Di Liberto, Tom. “August 2016 Extreme Rain and Floods along the Gulf Coast.” NOAA Climate.Gov, 19 Aug. 2016, www.climate.gov/news-features/event-tracker/august-2016-extreme-rain-and-floods-along-gulf-coast.
“Downpours in Louisiana, August 2016.” World Weather Attribution, 14 Aug. 2016, www.worldweatherattribution.org/louisiana-downpours-august-2016/.
Fischetti, Mark. “Why Hurricane Harvey Became so Extreme.” PBS, Public Broadcasting Service, 28 Aug. 2017, www.pbs.org/newshour/science/hurricane-harvey-became-extreme.
Invenitmundo. “Floodlist News.” FloodList, 9 Sept. 2016, floodlist.com/america/usa/louisiana-floods-cost-economy-10-billion.
Irfan, Umair. “A Hurricane Exposes Houston’s Infrastructure Weaknesses – Again.” PreventionWeb, 24 July 2024, www.preventionweb.net/news/hurricane-exposes-houstons-infrastructure-weaknesses-again.
Jones, Stephanie K. “Air Worldwide: Louisiana’s Record Rainfall Caused by Low-Pressure System.” Insurance Journal, 16 Aug. 2016, www.insurancejournal.com/news/southcentral/2016/08/16/423429.htm.
Lincoln, Scott. 1 2 3 4 5 6 Updated Rainfall Analysis for the May 1995 …, 2014, www.weather.gov/media/lmrfc/tech/2014_Updated_Rainfall_Analysis_May_1995.pdf.
Mercurio, Gabriella. “I-12 Barrier Upgrades Begin 10 Years after Historic 2016 Flood.” Https://Www.Wafb.Com, 12 Aug. 2026, www.wafb.com/2026/08/12/i-12-barrier-upgrades-begin-10-years-after-historic-2016-flood/.
Sainz, Adrian. “A Look at Some of the Deadliest Floods in the US in the Last 25 Years.” AP News, AP News, 7 July 2025, apnews.com/article/flood-deaths-flash-flooding-weather-408b11abe0389f38c93d8722b9d15dd0.
“SELA Orleans Overview.” SELA Orleans, 2008, www.swbnosela.com/Overview/.
US Department of Commerce, NOAA. “NWS LIX – Top Ten Events of 20th Century.” National Weather Service, NOAA’s National Weather Service, 15 Feb. 2025, www.weather.gov/lix/20thcenturytopten.
Wang, Simon, et al. “Synoptic and Quantitative Attributions of the Extreme Precipitation Leading to the August 2016 Louisiana Flood – Wang – 2016 – Geophysical Research Letters – Wiley Online Library.” Geophysical Research Letters, 5 Nov. 2016, agupubs.onlinelibrary.wiley.com/doi/pdf/10.1002/2016GL071460.
Weiss, Brittany. “Restore Louisiana: Building Resilience after the 2016 Flood.” WBRZ, 13 Aug. 2016, www.wbrz.com/news/restore-louisiana-building-resilience-after-the-2016-flood/.


Great Work!!! Nick should hire you after you graduate.