Howdy!
Thank you for taking the time to read my second research project. For this one, I started looking into it last year for a project I did in school and thought I would expand on it a bit and share it here! I really did enjoy doing this project, so I hope you find it interesting.
Here, we are going to take a look into atmospheric rivers and how climate change might affect them and in turn, Antarctica.
*ARs = atmospheric rivers
WHAT IS AN ATMOPSHERIC RIVER (and why they matter)?
An atmospheric river (or “pineapple express”) is a long and narrow band of moisture in the atmosphere that is known to transport heat from the tropics to the poles and carry heavy amounts of water vapor. They increase the temperatures of the affected regions and can lead to extreme rainfall events. In the United States, they tend to impact the west coast the most.
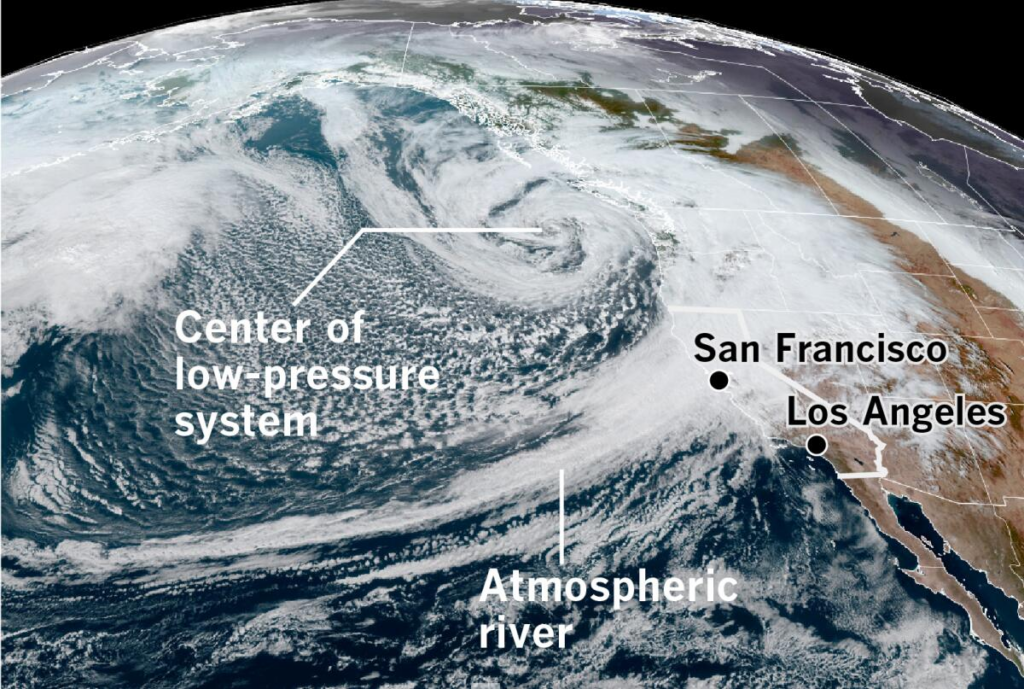
Though they don’t occur often, they tend to leave powerful and lasting impacts when they do. With their warm and moist nature, they can cause major melting, destabilization of ice, and amplification of long-term warming effects in Antarctica. It is important to look at the impact climate change will have on this weather phenomenon, and what that means for Antarctica.
A study done from the Advancing Earth and Space Sciences Geophysical Research Letters (Ma et al. 2020) states how atmospheric rivers in the past four decades have been shifting towards the poles, which is likely caused by human activities. This shift impacts the ocean temperatures, ice melt, and the frequency of atmospheric rivers. While this is known, the effect that climate change has on atmospheric rivers around Antarctica has not been researched extensively. That is why I wanted to look into it a bit since it really is an interesting topic.
WHY IS THIS IMPORTANT?
You might be wondering, “Why would I care about what happens in Antarctica?” which is a pretty valid question. Antarctica, a land mass that is covered in ice sheets, is important in Earth’s climate system, global ocean circulation, and stores a large portion of freshwater. The continent is important in researching Earth’s past climate and provides a home for an abundant number of organisms. Changes to the continent could lead to sea level rise (as the ice melts and falls into the ocean) and shifts in global ecosystems and ocean/weather patterns. The ozone hole is also important in this region.
While atmospheric rivers near Antarctica are in itself on the rare side, occurring only a few times a year, they are responsible for a large portion of the precipitation for the continent each year. Antarctica is more known to be on the dry side, often called a desert, so rain events are important, especially if they trigger ice melt. When atmospheric rivers pass through Antarctica, they could cause major ice melting and therefore contribute to global sea level rise. Understanding the effects of climate change on atmospheric rivers near Antarctica is crucial for predicting and preparing for their impacts.
A LOOK AT THE DATA TRENDS
These large precipitation events are more likely to occur during the summer months in the Southern Hemisphere, November to March. We are going to look at the ocean temperatures, precipitation trends and statistical correlation with temperature, and the amount of ice loss already occurring.
Antarctica does not warm at the same rate across the entire continent, some areas are warming more than others, while other areas are growing colder with time. The figure below visualizes how the ocean temperatures have changed over time, between 1995-2024 based off the 1951-1980 mean. Most of Antarctic oceanic temperatures have been increasing, the fastest and greatest warming occurring in the west at the Antarctic Peninsula (and just the western portion of the continent in general).
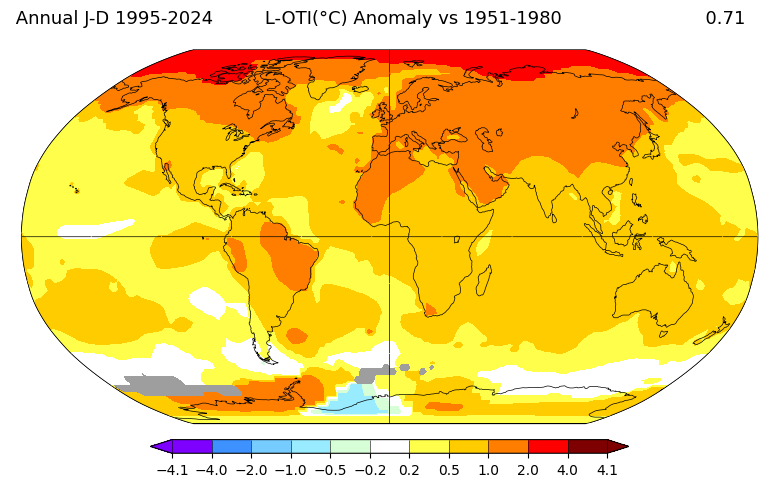
Below shows two different month periods, from Nov-Apr on the left, and May-Oct on the right. While both show a general warming trend, ocean temperatures seem to warm the most from May-Oct. While not directly linked to atmospheric rivers, it can be linked to human induced activities as the Southern Ocean is able to absorb a large fraction of excessive heat due to greenhouse gas emissions. This stored heat causes the SH winter months to be warmer than what has been recorded historically (Frölicher et al. (2015)).
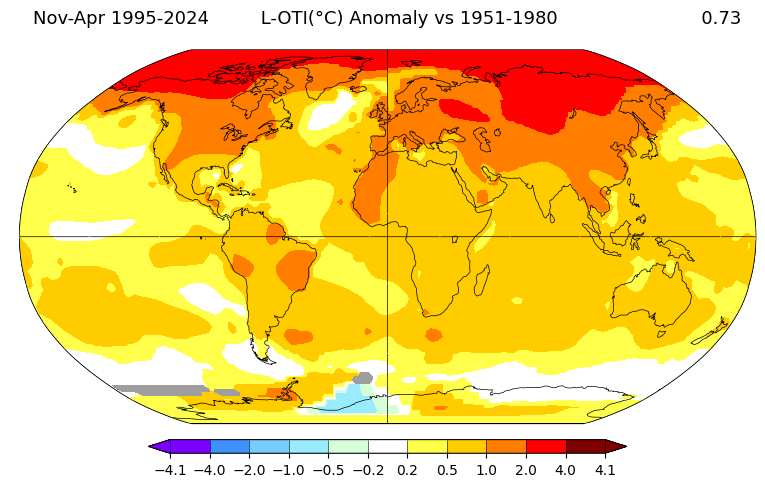
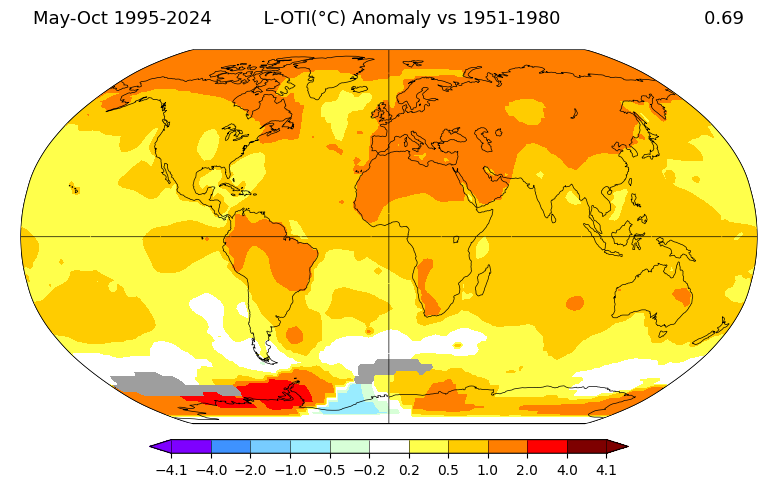
This increase of ocean temperatures through the last few decades are a product of different factors, ranging from its proximity to South America to the changing wind patterns (stronger westerly winds), the Antarctic ozone hole, and global warming. In Antarctica, atmospheric rivers occur near the most at the Antarctic Peninsula (Wille et al. 2025). This is due to the Peninsula’s close proximity to South America, so it is naturally closer to the subtropical and mid-latitude storm areas and tracks. This implies that it is on the right path to the moisture-rich air masses that come from the South Pacific and South Atlantic. This allows atmospheric rivers to transport the moisture and heat from these warmer and moist areas right to the Antarctic Peninsula.
In addition, the land temperature trend is not uniform across the land mass, some areas increasing, others decreasing. Same for the precipitation trend. In general, every +1 °C = 7% increase in water vapor, meaning as the atmosphere warms, it is able to hold more water vapor and therefore produce more rainfall. Looking at the temperature/precipitation trend is important to see this sort of pattern in Antarctica. In terms of ARs, a critical part of this weather phenomenon is its capability of holding and transporting a lot of moisture, so seeing the temperature trend and its influence on precipitation will be useful in predicting future trends.
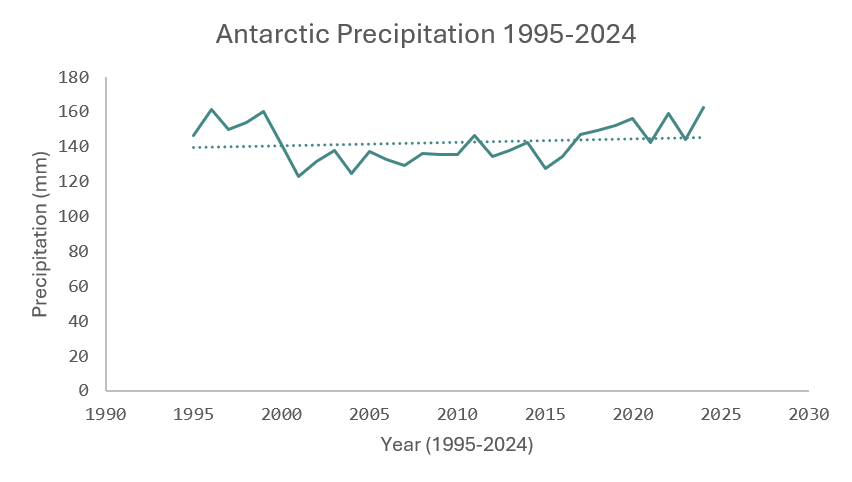
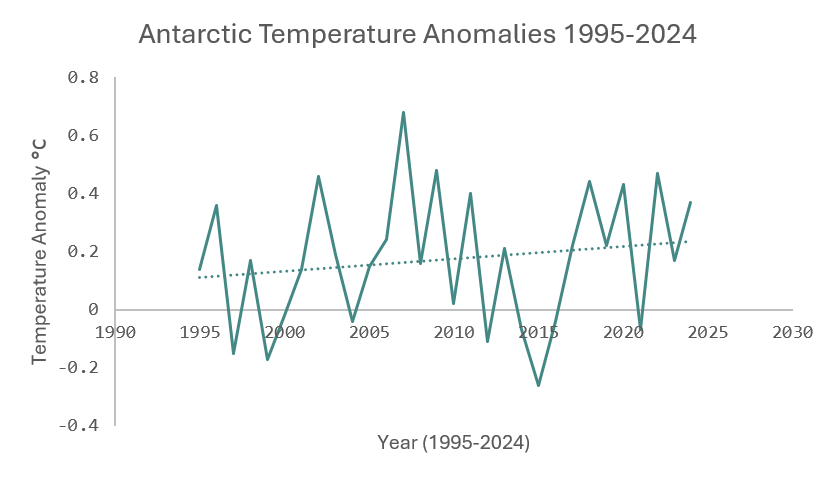
The figure on the left shows average precipitation through the years 1995-2024 in Antarctica. In this graph, precipitation amounts are not linear and vary year by year. Overall, the trendline shows a gradual increase in precipitation (very slight). The right shows temperature anomalies (°C) in Antarctica through the years 1995-2024. The anomalies fluctuate through the years, peaking then hitting a low several times. The trendline shows an increase in temperature anomalies through the years, showing a slight warming trend.
Putting the data on the same graph, we can visualize better any correlation between the two. The correlation coefficient, r, is equal to 0.19, implying the correlation is very weak, but still positively linear. However, this is for the entirety of the continent, so this can be looking over specific areas that experience more atmospheric rivers than others.
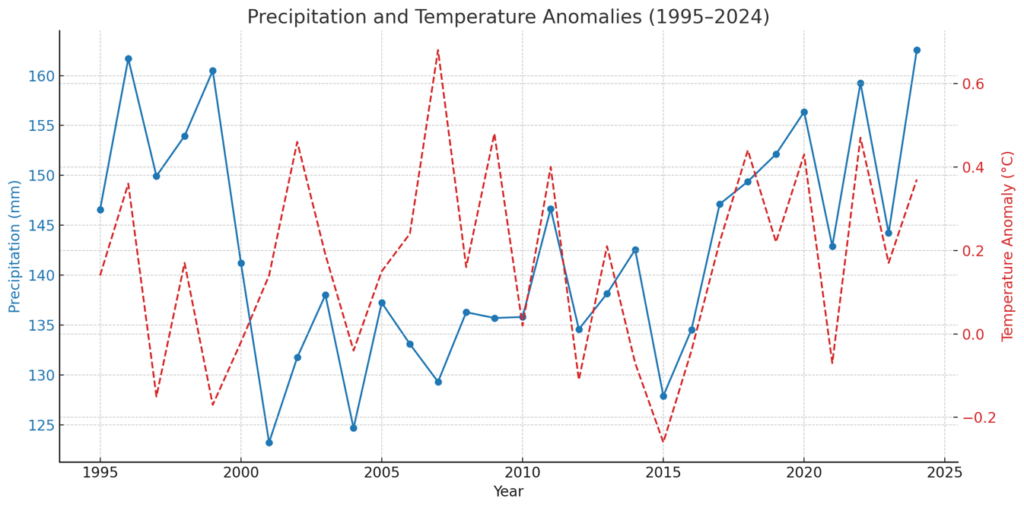
The data shows though that there have been some peaks recently where temperature and precipitation are more correlated. In the year 2020, there is a peak. This can be due to many factors, but in February 2020, there was a significant atmospheric river event where there was a series of atmospheric rivers that impacted West Antarctica, leading to significant snowfall over ice shelves. Another peak, 2022, could be because of an atmospheric river in February 2022 that caused surface melting over a large part of East Antarctica, an area previously considered to be more stable and drier.
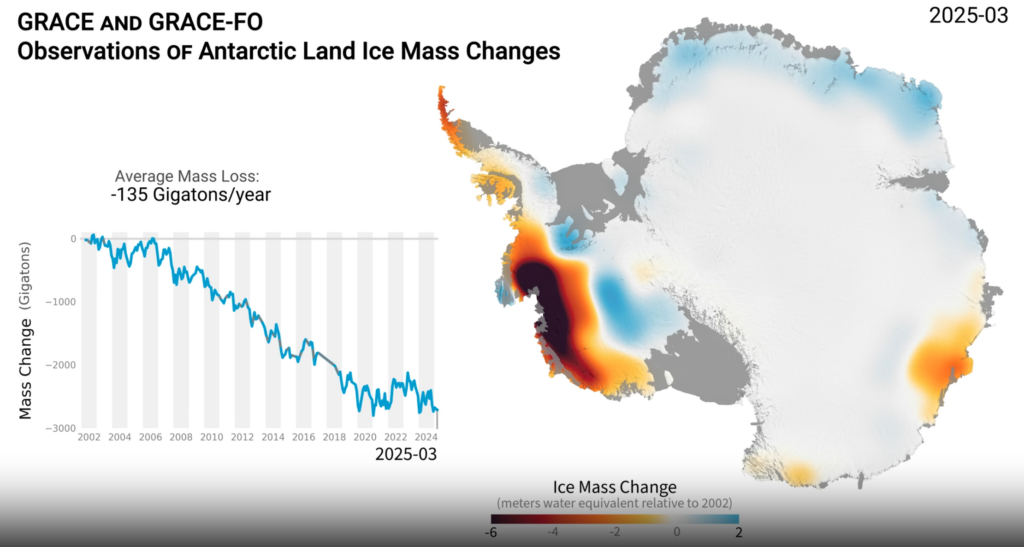
From the image above, it can be seen that the most ice mass lost is in Western Antarctica and along the Peninsula as well. It is also a fact that ARs occur the most in this region for the continent, potentially explaining part of the reason why there is the most ice melt there. This is important to visualize when discussing climate change impacts on Antarctica because it is prevalent that the ice melt and loss contribute to the global sea levels.
DISCUSSION AND CONCLUDING THOUGHTS
We know that over the last few decades, ocean temperatures have been increasing for much of the globe, including the Southern Ocean surrounding Antarctica, though not everywhere as some areas are actually growing colder. This implies the fact that temperature changes are not linear everywhere for the continent. This is what makes Antarctica complex in determining how climate change will impact each part of the continent.
Both the temperature and precipitation trends are increasing, even if it is just slightly. Some peaks in the data (especially in recent years) could be due to any atmospheric river event. As both temperatures and precipitation
increase as the years go on, it is likely that there will be more AR events in the future. When temperatures warm and atmospheric rivers transport more of that heat and therefore more moisture, it will continue to make Western Antarctica more vulnerable to ice mass loss and contribute to global sea levels rising. As atmospheric rivers continue to shift poleward in the Southern Hemisphere (which is due to greenhouse gas emissions, the ozone hole, and natural shift in sea temperatures), it is likely this will make the event more frequent than previously.
While much of the conclusions point to negative consequences of climate change, there could be some positive outcomes from this as well. Atmospheric rivers are already responsible for about 50%-70% of extreme snowfall events in Antarctica, so in the likely event where a warmer planet holds more water vapor, more snowfall is likely to fall over the continent!
As the planet continues to slowly grow warmer, atmospheric rivers are penetrating deeper to the poles in the Southern Hemisphere, bringing with them unique moisture and heat. These events are not only shifting Antarctic precipitation patterns, but also accelerating ice destabilization and mass loss, contributing to the continent’s vulnerability to climate change. Because of the complex relationship ARs have with Antarctica: both adding mass through extreme snowfall and also contributing to major ice melting, there is still a lot of uncertainty. What isn’t uncertain, though, is that the role of ARs in precipitation and ice dynamics is significant and growing.
LIMITATIONS
Of course, there are always limitations when doing research for anything. For one, ice data and atmospheric river data for Antarctica is limited and there is a limited amount of research on this topic, so there is lots of uncertainties. Results are not linear everywhere, so it is hard to come to one conclusion. Antarctica in itself is more complicated to do research topics on, especially in discussing climate change. Overall, I think this is something that will take more time to really be certain about, especially since AR events aren’t that common currently.
CITATIONS
Duginski, P., 2021: How did California’s recent bomb cyclones compare with the “Big Blow” of 1962? Los Angeles Times, 28 Oct 2021, accessed 17 Jul 2026.
Ma, W., G. Chen, and B. Guan, 2020: Poleward Shift of Atmospheric Rivers in the Southern Hemisphere in Recent Decades. Geophysical Research Letters.
GISTEMP Team, 2026: GISS Surface Temperature Analysis (GISTEMP), version 4. NASA Goddard Institute for Space Studies. Dataset accessed 15 Jul 2026, https://data.giss.nasa.gov/gistemp/maps/
Frölicher, T. L., and Coauthors, 2015: Dominance of the Southern Ocean in anthropogenic carbon and heat uptake in CMIP5 models. Journal of Climate, 28, 862–886.
NASA/JPL-Caltech, 2024: Antarctic Ice Mass Loss 2002–2025. NASA Scientific Visualization Studio, released 8 Mar 2024. Accessed 15 Jul 2026. https://svs.gsfc.nasa.gov/31158/
Wille, J. D., V. Favier, I. V. Gorodetskaya, and Coauthors, 2025: Atmospheric rivers in Antarctica. Nature Reviews Earth & Environment, 6, 178–192, https://doi.org/10.1038/s43017-024-00638-7


