I was surprised this morning when I checked in with the SPC outlook and saw that the map looks quite similar to last week.


From the SPC:
On Wednesday, an increasingly moist air mass is expected across the region ahead of an upper-level trough that will take on an increasingly negative tilt, with very strong deep-layer/low-level winds coincident with a modestly unstable air mass. The potential for extensive early day precipitation/cloud cover ahead of the cold front casts some uncertainty in terms of destabilization details, particularly with northward extent into the Tennessee and Ohio River Valleys.
Regardless, the extremely strong wind fields are concerning for the potential for long-lived supercells/fast-moving bowing segments where modest destabilization does occur. The most-concerning severe-favorable ingredients currently appear most probable across sizable portions of Louisiana, Mississippi, and Alabama.
Anyone else feel like Bill Murray?

Now before we all go stand in front of a bus, I’ve been digging into the forecast models this morning and it isn’t looking like things have changed drastically. But there has been some movement…
During previous events, some folks have asked if there is a way to ‘help’ or ‘say thanks’ for all of the forecasting work I do. For the longest time I said, ‘Nah! I do this to be helpful!’ But I was recently convinced that others want to ‘help’ like I do – just differently.
And their way of helping, or simply saying ‘thank you’ is with a donation to the blog to help keep it running – or to help keep me running. So I’ve added this link. If you are one of those people, let me say thank you to YOU.
CIPS Analogs
The one thing that has changed is the CIPS Analogs – both the Probabilistic Outlook and Historical Analogs.
Historically speaking, according to CIPS Analogs, this type of setup is likely to produce severe weather. But, despite the breadth of a geography with at least one severe weather event, the historical numbers for long-track tornadoes is lower, with the highest risk closer to Huntsville, AL.


It is interesting to note, though, that looking at the surface temperatures, none of the analogs are showing a good connection between past events and the upcoming event.

That spells a problem in two directions when using these analogs. On the one hand, if the analogs are under-doing temperatures then the resultant potential for surface-based storms increases. If they are over-doing temperatures then the potential for severe weather is over-estimated.
Plus! Temperatures that are warmer in the pre-frontal environment compared to the analogs then it could be the result of less cloud cover, or a stronger low-level flow from the south, or could indicate that the warmer air overcame a cap of warm air aloft and there are supercells, or a mucked-up congested batch of nothing burgers!
I suppose you guys get the idea. It is annoyingly complicated. And we can’t use one thing to try and figure out a full forecast.
Let’s see if we can get a hint from the Probabilistic CIPS Analogs guidance.

There might be a bit of a hint here. This is looking at the historical stuff, sure, but it is also trying to make a prediction based on the past – taking into account the model data moving forward. And this is showing the highest risk closest to the coast. Perhaps a nod to the fact that storms may be slightly instability-starved as you move northward.
Perhaps.
Model Data
Looking at the estimated radar shots from the Euro and GFS, and they are starting to look a bit more similar. The below animation is looking at Wednesday evening – around 7p.
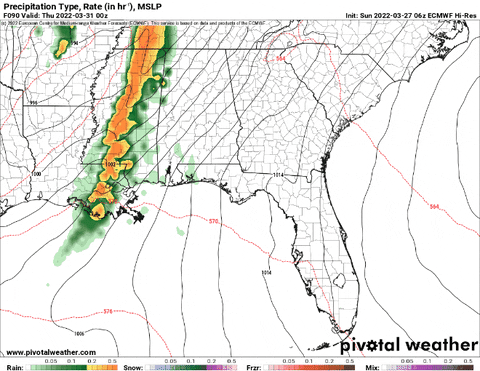
Two changes. The first one is that the GFS isn’t leaning as much and the Euro is leaning a bit more. That is to say that the “line of storms” isn’t as up-and-down on the Euro and isn’t as slanted on the GFS.
Why does that matter? To the White Board! Let’s draw!

If the line of storms is aligned more up and down, in this particular setup, the inflow at the lower levels is going to be parallel to that alignment and to storm motion. So the shear in teh lower levels is more speed shear than directional shear.
But! If that line of storms is more slanted, it is a bit different.

Again, in this particular setup, if the line of storms is more slanted, that can increase the low-level directional shear and increase the chance things spin in the lower levels. And thus, increase the tornado threat.
That is probably a bit of an over-simplified breakdown, but I think it may help a lot of folks wrap their head around some of this stuff. And expand on what I discussed in yesterday’s write-up.
The other change from both has actually been to decrease the amount of pre-fontal showers. So the light greens ahead of the mass of oranges isn’t as widespread. That is an indication that the models are less impressed with the showers ahead of the line. And that is something that has been pretty evident the last few days – especially from the Euro.
As the line of storms approaches, the pre-frontal environment doesn’t look overly favorable for supercells ahead of the line from either model. Both show an open atmosphere with no cap, leaving plenty of space for clusters of pre-frontal showers and tiny storms to develop. So while the models don’t show that above, the raw data below says they are possible (and I would argue ‘likely’).


That doesn’t mean we won’t see the big storms ahead of the line, it just means that things look less likely. And those storms ahead of the line, as many of you have learned over the years, are the big ones that tend to produce the stronger tornadoes.
The near-storm/in-storm environment tends to look different between the models, though. The GFS increase instability and reduces the directional shear while the Euro holds instability lower and holds the directional shear.


In English? The GFS looks like more of a wind event with the chance for an embedded supercell to have brief and weak tornadoes. The Euro looks like more of a wind event with embedded supercells that could produce slightly stronger tornadoes in places where the instability is locally higher.
And being able to figure out the ‘locally’ parts won’t come for another 24-48 hours. But we can get an early look from the Karrie Meter
Karrie Meter
The Karrie Meter came back mostly unchanged today, but there are some places where things shifted slightly and I think it is worth noting.


The timeline has slowed down just a hair, but it still looks like storms will be through Louisiana by 7p, through Mississippi by 10p and into eastern Alabama by 1a.
But there are also some spots of higher values today, where yesterday everything was just 3s and 4s. And while these maps will continue to change during the next few days, it looks like it is trying to pick out a few spots with a slightly higher potential.
At 4p, for example, there are a few splotches of 5s. One east of Memphis, one north of Jackson, and one near Hammond.
I also ran the plus/minus 10-percent maps, too. This gives me an idea about where things stand if the model guidance is too low or too high with some of the parameters.
So for the same map above, here is a look at plus 10-percent and minus 10-percent.


You can see how close we are too a wider spread of 5s and even a few pixels of 6s. But if the models are too high by 10-percent, it also means this is a total Nothing Burger. With a side of Blah.
So, like most times around here, we are teetering right on the edge.
The Bottom Line
As of now, things are still a bit up in the air, but it looks like yes, there is another chance for severe weather this Wednesday. The timeline puts things starting as early as 1p and ending by 1a. A wide window for the moment because we are still more than three days out and I’m capturing a wider area.
The main threats, at this time, look to be heavy rain, flash flooding, frequent lightning, wind gusts up to 65mph, hail up the size of quarters, and the potential for a few tornadoes (up to EF3 in strength). But not everyone will see the worst of the worst. While I do think everyone – like, everyone! – will see heavy rain and wind gusts up to 45mph, I think the higher wind gusts, hail and tornado threat will be pretty isolated.
Things that could change include the timeline (by a few hours) the threats (higher wind speeds for more people), and the potential for storms ahead of the line.
We will continue to learn more every 12 hours as new data comes down. And as things change I’ll do my best to keep everyone updated!


