The Storm Prediction Center has increased the severe weather risk to an Enhanced Risk, that is a “3” on the 1-to-5 scale where “5” is the highest risk for the most significant severe weather.

Last week parts of the same area were under a Moderate Risk, a “4” on that same scale. For reference, here is how the SPC Risk looked underneath all of the Tornado Warnings issued by local NWS Offices.
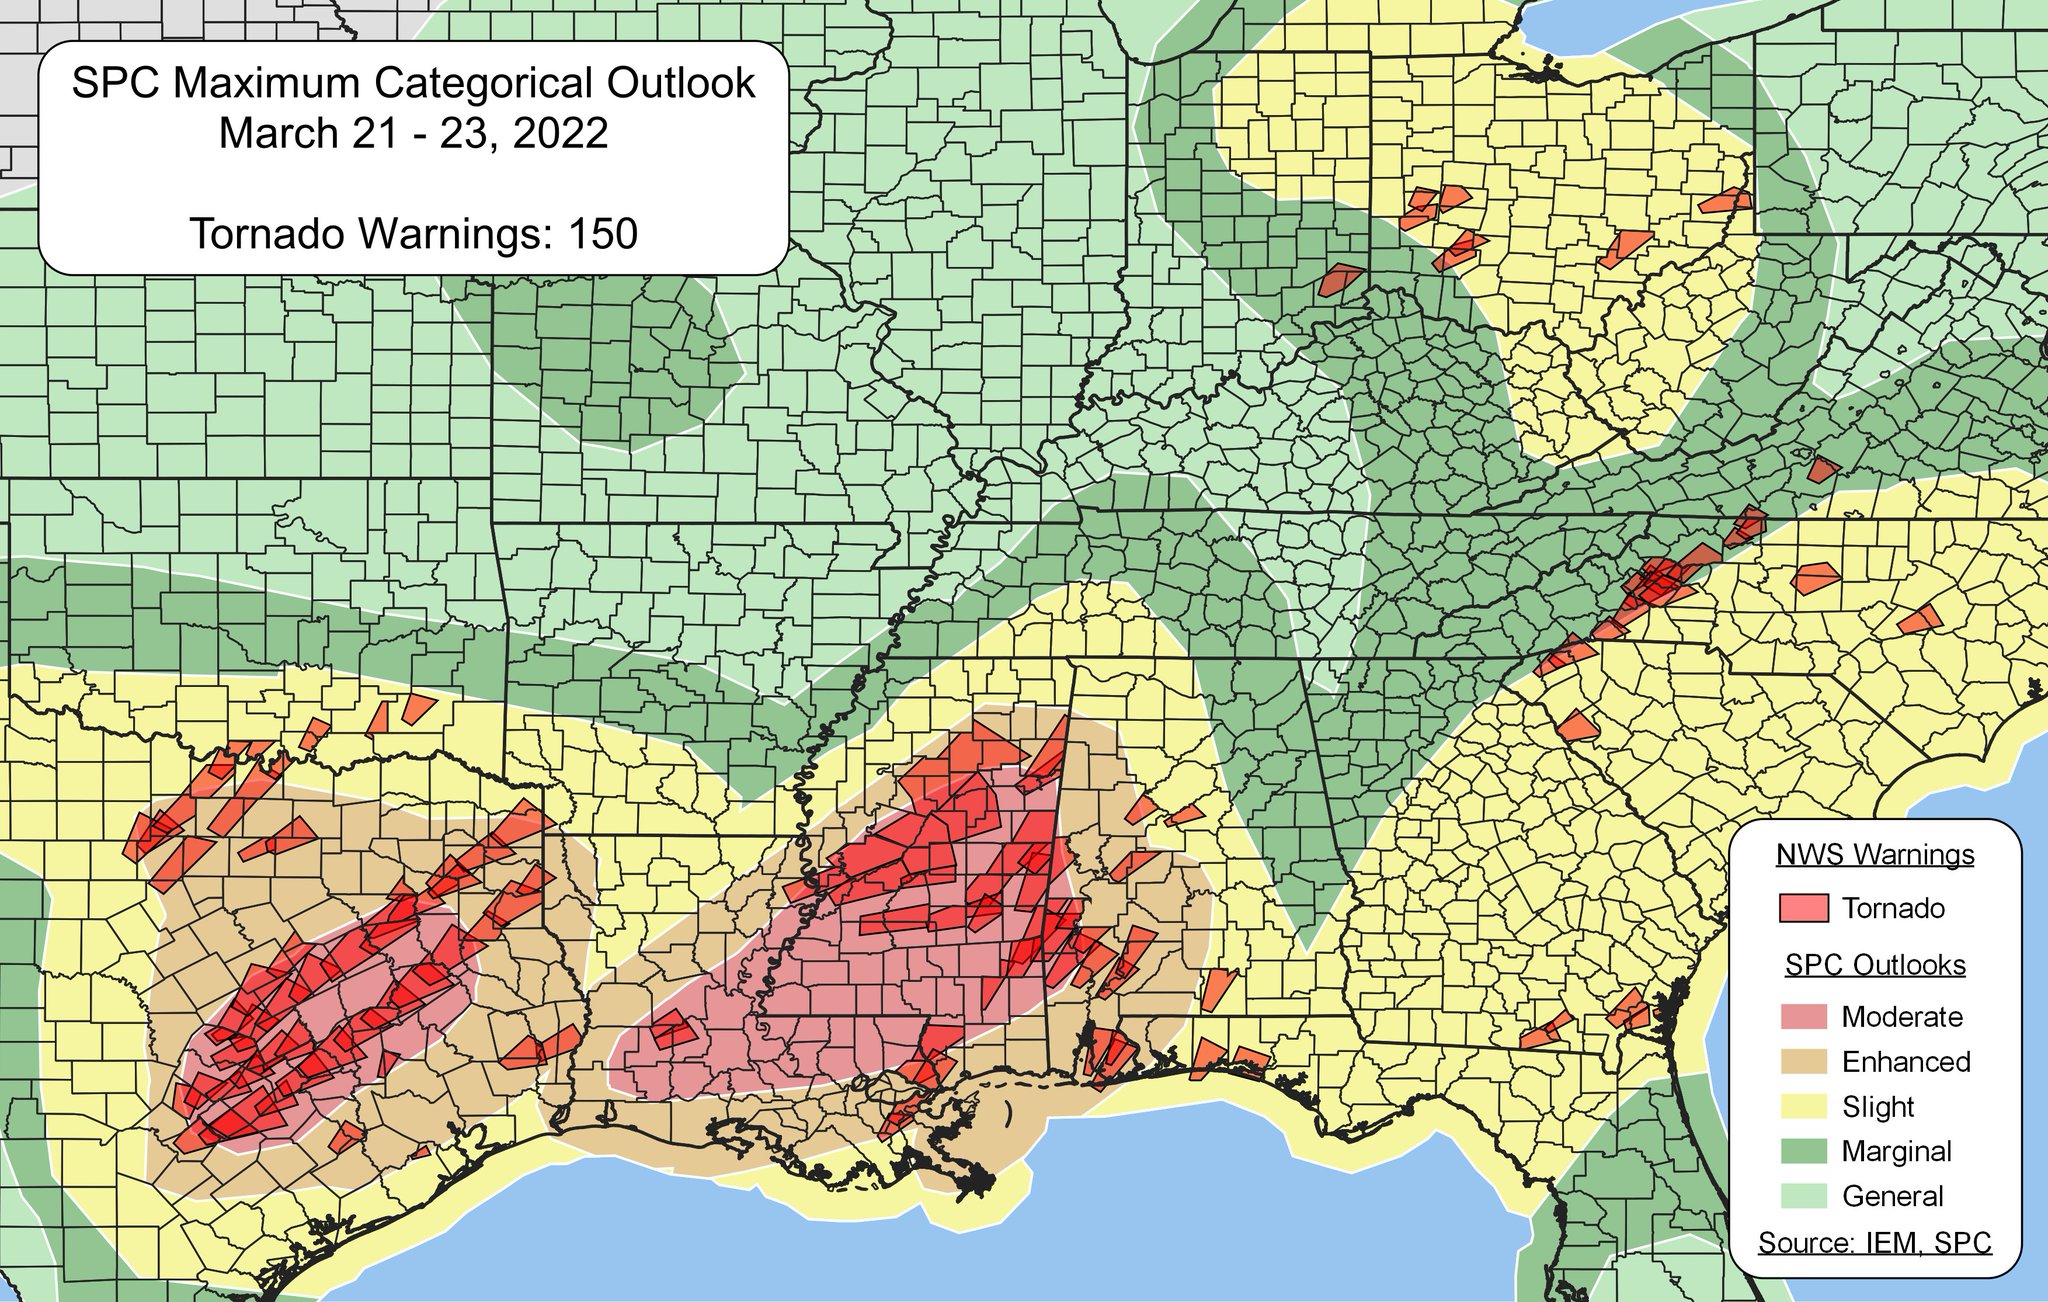
The SPC has a pretty good track record of nailing down where the potential for storms will be. Last week was no different.
While there is a similar severe weather risk, this upcoming week the setup is different than last week. And that is very important to know. Because last week there was a chance that some folks didn’t see much of anything.
This week there is a good chance that everyone sees something. This type of setup should promote the development of a deeper squall line that will push through the entire region cohesively and doesn’t break apart like last week’s event.
That means a few different things for threats, but we will get to that later.
The Setup
There is still a fair bit of model uncertainty with respect to this next system. The GFS and Euro have things shaking out a bit differently. Neither one is 100-percent accurate. And, honestly, I’m leaning away from the European model at this time because it is showing something in the mid-to-upper atmosphere that – historically – isn’t as likely to see in situations like this.
It doesn’t mean it can’t happen, it just isn’t as likely, so I’m going to lean toward the GFS as the more likely model to be on the right track as of now.
The difference?


The secondary low on the Euro model that swings around to the south on the backside of the area of low pressure lifting north is something that seems less likely. The Euro also keeps the area of low pressure a bit farther south while the GFS takes the Low much farther north. And the farther away the area of low pressure, the lower the risk for significant severe weather.
I want to stress that the Euro model may end up being more correct than the GFS, but at this juncture in time, I’m not going to lean that direction.
But wait, Nick, didn’t the SPC just increase Risk?
They did! And this is why weather can be frustrating to forecast and communicate. While the model guidance that I’m leaning toward is less likely to produce the as much significant severe weather, it is more likely to produce more widespread severe weather.
Both will be able to produce tornadoes. The ceiling for strength given the global models very general data would suggest up to EF-3 tornadoes possible. But that may change in the coming days as we get better access to higher resolution data.
A quick look at the Skew-T data will highlight the difference between the GFS and the Euro and we can talk about what the differences mean. We are going to look at the same time period as above and grab Skew-T data across the entire Southern MS/AL/LA Region. This means picking up some places ahead of the line and behind the line. So the temp/dewpoint line won’t be as much help.
Instead, lets focus on the wind.


The GFS on the left shows more speed shear and less directional shear than the Euro on the right. That means the Euro is showing an environment more capable of producing tornadoes. Plus, the amount of low-level Helicity on the Euro is nearly double that of the GFS. And that lowest level of Helicity is very important for tornado development – specifically the bigg’ins.
However, that isn’t the only thing that we look at for that. And I really, really, really want to drive that home. Creating tornadoes takes a lot and there are multiple parameters to look at when evaluating a true tornado threat – at least five other things that I can think of before I even blink.
But the high-level data shows the Euro show an environment more likely to produce tornadoes than the GFS. And I am leaning away from the Euro and leaning toward the GFS for my forecast. So the tornado threat is low, right? Not really. That may not be the whole story.
Angle may matter
So the kinematic (fun word for “motion of objects without reference to the forces which cause the motion.” environment from the Euro may seem more like the tornado producing environment. But a lot of that may be locked up ahead of the front and not along the front itself.


The the GFS shows pre-frontal with higher CAPE lower Shear. The Euro shows a pre-fontal environment with lower CAPE and higher Shear. So ahead of the front, if storms develop, the Euro may be the healthier tornadic environment. But along the front that may not be the case given the angle of the estimated squall line.
The GFS model shows a more angled approach of the front and storms while the Euro shows a more vertical line of storms.


This translates to the Euro with inflow angle more parallel to the line – limiting embedded tornado threat to bowing segments and storms ahead of the line.
And a bit like last week, if/when storms develop ahead of the line is a bit of an unknown until we get a bit closer. So, for the moment, the data suggests that the GFS may allow for embedded supercells and tornadoes. And that possibility may actually be more likely than the outcome from the Euro anyway.
On top of that notice how the line of storms depicted stretches from the Gulf of Mexico all the way north of the area. That means everyone – everyone! – will see rain and wind from this event.
Complicated. Tough to communicate. Annoying. If you’re reading this going, ‘what, wait, really?’ I get it. If you are sitting here reading this thinking, ‘wait what? I don’t get it?’ I also get it. Hang with me, we are almost there!
Karrie Meter and CIPS Analogs
Taking an early look at the Karrie Meter maps from the GFS, and it shows the peak threat is in the same area that the SPC has highlighted for the peak threat. We are still pretty far out, so these maps are likely to change in the coming days, but this is a good first peek at how things may shake out.


In the 4p map, notice the patches of yellow? That is the Karrie Meter trying to pick out the spots where that inflow angle, relative to storm alignment and motion, is increasing the local threat for severe weather.
Again, this map is likely to change. So don’t get too caught up on specifics spots. But it is a good first look. It also allows us to get an idea that the peak threat timeline is between about 11a and 6p as it traverses the same areas that had to deal with severe weather last week.
The Karrie Meter map is supported by the CIPS Analogs showing that the potential for at least one severe weather report across the region is reasonably high.

The Top 15 Analogs show a better than 70-percent chance that at least one severe storm report occurs within about 70 miles of a point. Those same Top 15 analogs also all scored about an 11 on the 1-15 scale, making them all statistically significant for predicting a severe weather potential.
The Bottom Line
There is still a lot to shake out in the coming days, but it looks like the increased Risk from the SPC was warranted for sure. It also looks like this will again be an afternoon/evening event. There will also look to be a chance for heavy rain, lightning, wind gusts up to 65mph, hail, and the potential for a few tornadoes.
Again, the main timeline looks to be Wednesday afternoon/evening.
Please keep checking the forecast and if you have plans for Wednesday afternoon and evening, you may want to have a back-up plan, too.


