Your local meteorologist / mathematician / statistician here. I’m just checking in to give everyone some context to some recent comments made by some government officials.
I’m not a doctor, but I do enjoy statistics and mathematics. This post will dive into those things.
Before I being and we revisit the numbers, I used the word “government” so I want to make something super clear: This post is free from any political slant or agenda. As I’ve said from the start of this, my job is not to have an opinion. My job is to show you the facts and numbers. What you will see here is plain math. You guys can easily double-check my math, too. This is all basic addition and division.
If you look at the numbers and then decide to have a different opinion, I cannot control that. All I can show you is the numbers. Those numbers will then highlight the most likely reason for an increase in cases.
If you choose to ignore the numbers and feel otherwise, that is fine. I’m not going to stop you.
Marches aren’t “likely” to blame for higher numbers in Mississippi
Recently, there was a note posted that the increase in recent COVID cases is due to the recent protests and marches. And while there is no rock solid evidence for that, there is also no rock solid evidence against it.
That is, sadly, the predicament we are in with COVID-19.
Because it can be passed around silently by those who are asymptomatic, sometimes there is no specific and direct cause-and-effect relationship with a bump in numbers.
In the case of protests, I do have some reasonable evidence showing that the protests weren’t likely the cause of the recent spike.
I posted a few days ago that the marches and protests were probably not to blame for the recent rise in numbers. Math supported that. But I wanted to double check my numbers and take some extra factors into account to make certain my findings were accurate.
So let’s recap real fast….
The marches and protests picked up in late May but didn’t really begin in Mississippi until early June. Based on local media outlets, the first organized marches / protests involving “large groups” were around June 5th and those continued until around June 12th. There were some marches before and some after, but for trying to nail down things, we have to put up a fence somewhere.
Looking at the numbers in the two weeks since that timeframe, the number of daily cases has definitely increased in Mississippi. There were, on average, about 461 new cases per day in the two weeks after each day with a protest. Comparing that to about 308 per day in the two weeks prior.
In the previous post, I used the average incubation period of five days to make my calculations. However, since the incubation period for COVID-19 is two to nine days, using the five-day average period may not tell the whole story.
So I went back and took the average for two to nine days after Memorial Day, the protests/marches, and the great weather we had in June.
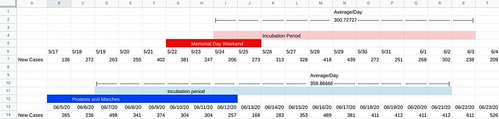
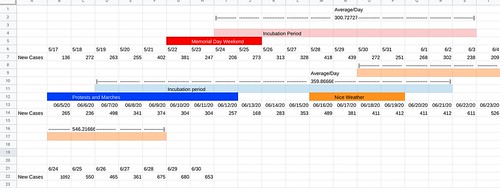
Looking at the two to nine days after each day with a march, the average new cases per day were 360. Still higher than 308 per day, for the two weeks prior, sure. And still a bit higher than the two to nine days after Memorial Day (300 per day).
Did the marches help get things under control? No. large gatherings were definitely frowned upon by the CDC at that time.
That said, it is still well below the number of new cases per day for the two-to-nine days after our three-day stretch of gorgeous weather between June 16th and June 19th. During that time, there were many situations where large gatherings were taking place at local rivers and lakes, backyard BBQs, and people just generally enjoying life.
For the two-to-nine days after each of those days, the average number of new cases per day was 546. Including a record high of more than 1,000 new cases in one day.
But wait, Nick! Some of those days overlap!
You’re right. Some of those days do overlap. In fact, there were some marches and protests in late May in Mississippi. Those dates would then overlap with the Memorial Day incubation period.
This is why it is difficult to pin the increase in numbers on one thing or the other.
Though, given the proximity to the drastic increase, it is more likely that the increase in numbers recently was more likely in response to people being out and about during the great weather than being out at a rally or protest. Since the incubation period for people contracting the virus ends before the true increase in numbers begins.
This may be further supported by the recent research with “superspreaders” too. But that is leaving the statistics world and entering into the medical world with recent new hypotheses.
But it looks like, even with double-checking my numbers, and expanded the parameters, Mathematics has come to the same conclusion.
Can I be 100-percent certain of these findings? Absolutely not. Like I said originally, there is no rock-solid evidence for or against the hypothesis. This data can only show a likelihood, not a certainty.
Here is a look at some of the “major” dates for COVID-19 numbers in Mississippi as well as the five days (average incubation period) after those dates and the two week after.
| Total | Five Days after/per day | Two weeks after/per day | |
| Since this started (Mar 11) | 28288 | 4.60 | 41.50 |
| Since Shelter in place (apr 3) | 26927 | 161.80 | 201.64 |
| Since re-opening (apr 28) | 21939 | 261.60 | 251.50 |
| Since Memorial Day (May 25) | 14550 | 354.00 | 312.71 |
| Since BLM Marches (June 5-12) | 11512 | 366.58 | 461.95 |
| Perfect Weather (June 16) | 7640 | 608.00 | 545.71 |
Looking back at the numbers in Mississippi in 14-day increments, we have had some plateaus and dips, but in general, this virus continues to spread. And recently that spread has really accelerated.
| Two week increments | Totals | Per day |
| March 11 – 24 | 380 | 27.14 |
| March 25 – April 5 | 1630 | 116.43 |
| April 6 – 19 | 2774 | 198.14 |
| April 20 – May 3 | 3365 | 240.36 |
| May 4 – 17 | 3555 | 253.93 |
| May 18 – 31 | 4320 | 308.57 |
| June 1 – 14 | 4047 | 289.07 |
| June 15 – 28 | 7149 | 510.64 |
Some added context
Locally, I’ve chatted with a lot of folks about the “more testing, more cases” thought process. And it is not a bad premise. Because with a virus like this, the more you test, the more people you’ll find.
But there are days where there are actually fewer tests than given a few weeks ago. Yet they are still finding more people infected.
On top that, sadly, this thing keeps killing people. Regardless of how many people get infected, the death rate is still 3.7-percent of known cases in Mississippi. The death rate peaked in early May at more than six-percent. And is now down to around two-percent.
And while that is better. It still means for every 100 new cases, two people die. So when you see news like, “600 new cases today,” you can safely assume at least 12 people will be dead from the new cases announced.
That is terribly sad.
And, hopefully, motivation to do all you can to slow the spread of this virus by doing all you can to follow the guidelines set by the medical community and local governments.


