There has been a lot that has happened in the last few days with COVID-19 – both in Mississippi, regionally across parts of the south and within the country. I wanted to help summarize it all from the scientific side of things as well as put some of this into context.
To start: The numbers are going up across the country very quickly. And not just because the country is testing more. The ratio of positive have-COVID-right-now to negative is going up. The antibody test is not responsible for the noted rate of increase. Double-testing is not responsible for the increase, either. Those two things do add to the numbers. I cannot refute that. There is documented evidence of that.
However, the numbers of antibody tests and double tests are minuscule compared to the number of people who are sick, being tested, and testing positive.
The numbers are rising because more people are being infected.
The Numbers
| Total | New Today | |
| World Health Organization | ||
| Worldwide Cases | 11669259 | 168957 |
| Worldwide Deaths | 539906 | 4147 |
| CDC | ||
| US Cases | 2982900 | 50304 |
| US Deaths | 131065 | 932 |
| Johns Hopkins | ||
| Worldwide Cases | 12041480 | |
| Worldwide Deaths | 549468 | |
| US Cases | 3054699 | |
| US Deaths | 132300 |
To put those numbers into perspective. The United States was responsible for 29-percent of the new cases in the world Wednesday. And the United States was responsible for 22-percent of the COVID-related deaths in the world.
That is heart-breaking.
Regional Numbers
Looking regionally, in Mississippi, Alabama, Louisiana, Arkansas and Tennessee, the numbers continue to rise everywhere. Here is a snapshot of the numbers to date:
| Total Cases | Tested | Deaths | %-positive | |
| MS | 32888 | 327087 | 1188 | 10.05% |
| LA | 70151 | 865000 | 3231 | 8.11% |
| AL | 46424 | 467754 | 1032 | 9.92% |
| TN | 55986 | 950540 | 685 | 5.89% |
| AR | 25246 | N/A | 305 | #VALUE! |
| Total | 230695 | 2610381 | 6441 | 8.84% |
And a look at the hospitalizations. The asterisks indicate the total number hospitalized, not ‘currently’ hospitalized. Also listed is the number of people currently on ventilators.
| Hospitalized | Ventilators | |
| MS | 449 | 148 |
| LA | 1022 | 100 |
| AL | 3006* | |
| TN | 3023* | |
| AR | 358 | 79 |
| Total | 1829 | 327 |
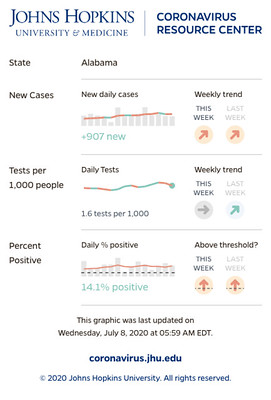
Johns Hopkins University produce these quick sheets about testing.
 |
 |
 |
 |
 |
Making Estimations
I talked about research from the Cruise Ships that may be relevant to estimating the number of cases without testing everyone (since that isn’t a feasible option). Plus, this type of estimate would make a good “first guess” at the number of asymptomatic people (the people who don’t feel sick, but are still infected), too.
This type of estimating isn’t perfect. In fact, it is far from it. And it is just an estimate. But based on the past research, it is at least a start.
| Est Symptomatic | Est Asymptomatic | Est total | |
| MS | 50,161 | 11,011 | 61,172 |
| LA | 106,994 | 23,487 | 130,481 |
| AL | 70,806 | 15,543 | 86,349 |
| TN | 85,390 | 18,744 | 104,134 |
| AR | 38,505 | 8,452 | 46,958 |
| Total | 351,856 | 77,237 | 429,093 |
As a reminder, this would be the total number since this is all started. This is not an indicator of current, active cases.
In Mississippi
The numbers, as shown above, continue to rise. The state has produced more than 500 new cases per day 12 out of the last 16 days. Some of these new cases are tests for antibodies, too. Mississippi Department of Health’s Dr. Dobbs has noted recently, from testing data, that about two-percent of those tests were coming back positive. The daily totals are showing about 100 of these antibody tests per day, so that means about two “new” cases per day are the antibody tests.
Of the more than 500 per day on 12 of the last 16 days.

The above chart shows some actual numbers as well as some estimated numbers. It should be noted that the “contagious” column should also say “estimated” but it looks like it got cut-off.
The most important column on there may be the estimated contagious. Because that is an effort to identify how many people may be walking aorund the state right now with the ability to infect others. And that number is about 16,000 people.
That is active cases, right now. About 16,000. That puts one infected person for every three square miles. Pretty crazy.
The other estimate on there is the number of people “still sick” given the medical community’s estimate that the COVID-19 illness lasts 14 days. There are currently nearly 10,000 of your neighbors currently sick and fighting this thing.
Of note, the estimates made on that chart are based on previous research (like the research referenced in the previous section) and not mathematics that I came up with. I am applying mathematics that medical researchers from University studies and medical research groups have found.
And I really want to stress this: Independently-funded researchers and scientists have determined the estimates that I am applying to the numbers in Mississippi. These are super smart men and women who spend their lives and careers attempting to understand viruses, viral spread, and community spread. I am simply applying their great work to our local population.
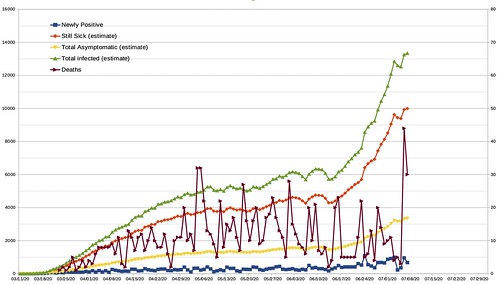
The above graph highlights how many new cases per day there are and how – since COVID-19 symptoms last, on average two weeks – the estimated number of currently infected people continues to rise. You can also see the sharp increase in deaths from COVID-19 in recent days.
Why all of the deaths suddenly?
Well, the medical community often points to the “life-cycle” of a fatal COVID infection to be, on average, between 4 and 14 days. So, you look back in time from the days of the recent spike in deaths and you find that about 14 days ago was the first real spike in the number of new cases. Since the death rate in Mississippi has – historically – been around three-to-four percent, that means 3-to-4 of every 100 new cases will result in death.
From there it is basic mathematics. If a day has 600 new cases, eventually about 21 people will die.
Now, it changes when younger people are infected. The death rate is much lower. But the basic estimate holds. And explains the recent jump in deaths. Given this, it is expected for the number of deaths to continue to run near or above “average” for the next week or two. And the average number of deaths per day is about 12.
New Research
No new research to breakdown this morning, sadly. I wish I’d had time to look through more journals, but I have not. I will have an update out shortly with information on COVID-19 and how it is infecting kids (because it is, despite what many think), COVID-19 and the lungs, as well as a look at the latest from the Mayo Clinic, Harvard and the New England Journal of Medicine.


Sick to Weather you fool you are NOT a Doctor… Wish you would move back to were you came from in the NW. We don’t need you here.