Better late than never, right? I was planning on having this done in mid-May but with the move, my sister’s wedding and starting a new job, I have to kick this can about two or three weeks down the road.
Apologies.
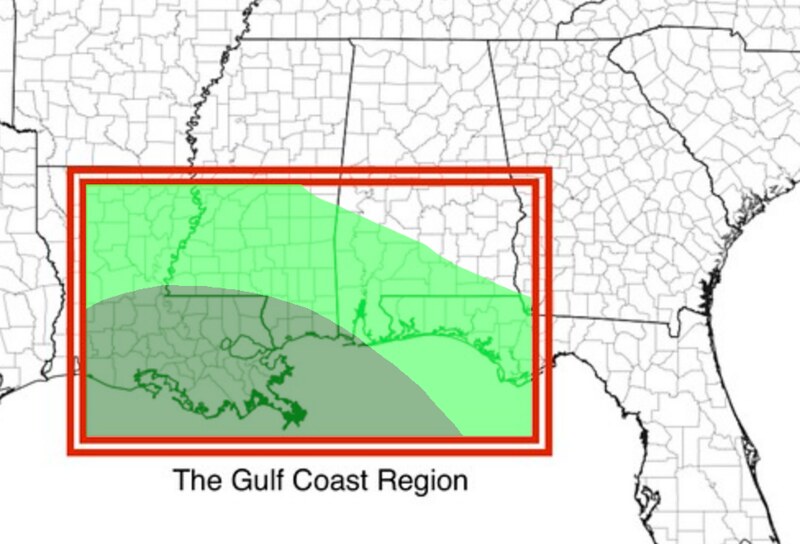
The goal of this outlook is to give you some insight into the summer weather – in a very general sense – for the area highlighted in the graphic below. This isn’t just for South Mississippi, technically. But that is the area I forecast for, so that is going to the be the area I highlight most. But this is also applicable to parts of Louisiana and Alabama. As well as parts of the Florida panhandle and a sliver of Georgia. And perhaps even extreme southeastern Arkansas, too.

This may not give you much insight into day-to-day weather, but hopefully will help offer a guide over general weather patterns and how they may influence the weather over the course of the summer.
Getting to the point, quick
Without making you guys “go through the ropes” I want to showcase the forecast up top here. It looks like overall the area is looking like Slightly Below Average temperatures with Above Average precipitation.

Broken down by month, here is how things look to shake out:
June:
Temperatures: Average
Precipitation: Above Average
July:
Temperatures: Slightly Above Average
Precipitation: Slightly Below Average
August:
Temperatures: Slightly Below Average
Precipitation: Above Average
September:
Temperatures: Slightly Below Average
Precipitation: Slightly Above Average
Analog Years
Looking back through the teleconnection analogs, the Big 3 that I like to look at for regional seasonal forecasting is ENSO, the PDO, and the NAO. These aren’t the only ones, and these may not even be the “best” ones, but they ahve done well for my seasonal outlooks in the past, so I continue to utilize tham.
This time, I only looked back to 1990. Since the new 30-year normals are out and they go from – basically – 1990 to 2020, I figured I should keep my fence posts within that set of years. If there weren’t enough years to pull from, I could widen things out, I suppose, but thankfully we hit on all three.
| TLECONNECTIONS | YEARS | |||
| ENSO | 2018 | 2012 | 2008 | 2000 |
| PDO | 2012 | 2008 | 1999 | |
| NAO | 2012 | 2008 |
It looks like 2012 and 2008 are the most similar years to this Spring / forecast Summer across all three teleconnections.
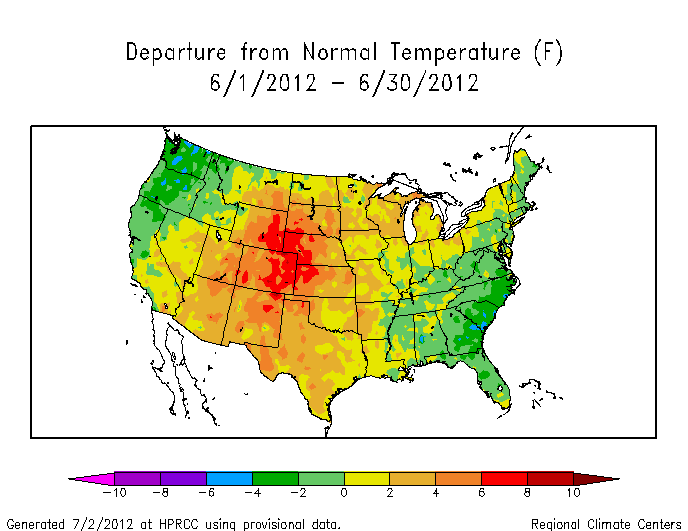
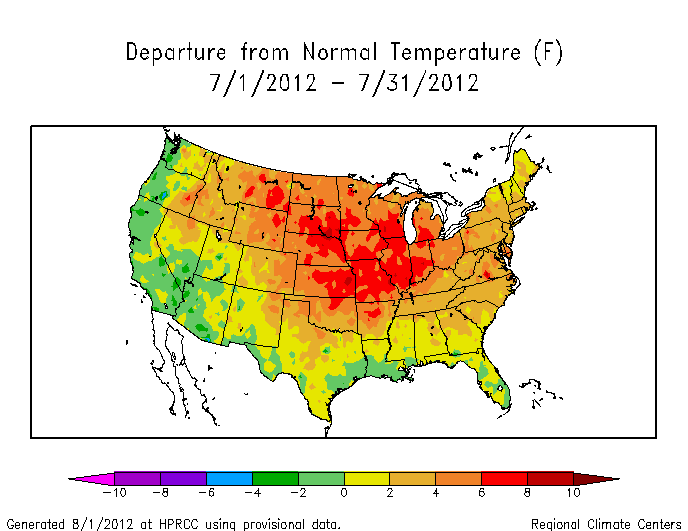
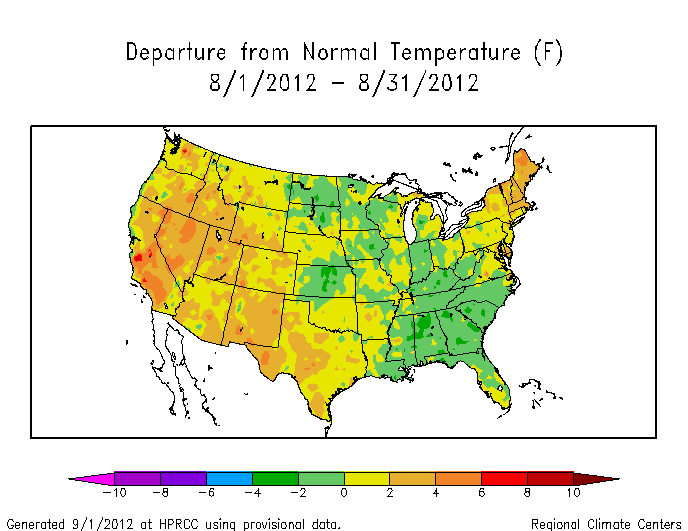
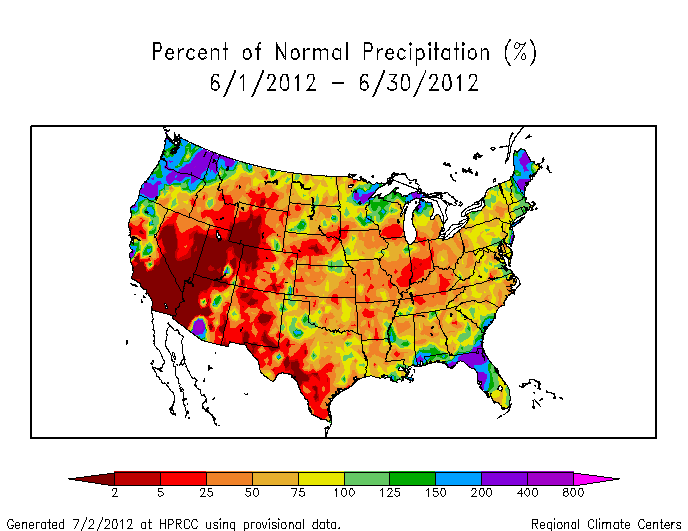
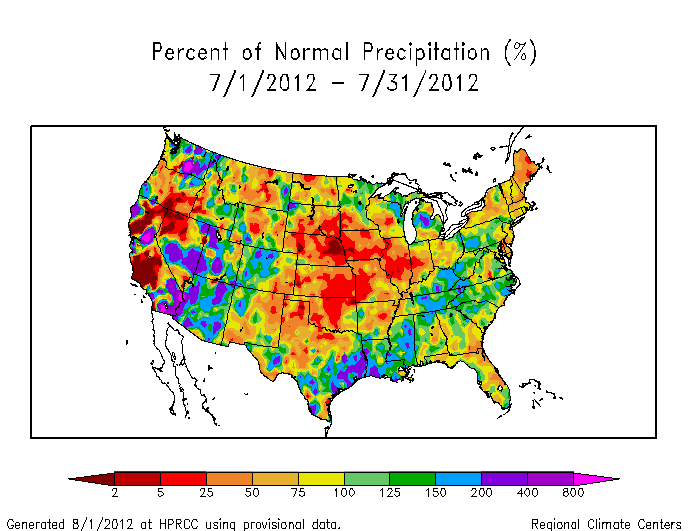
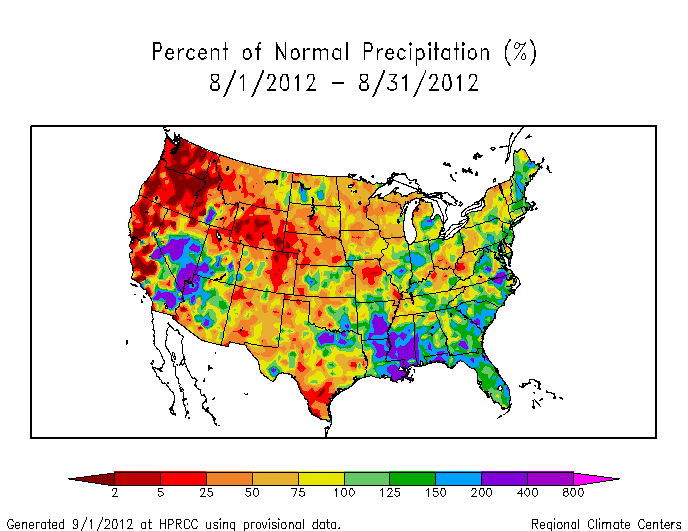
Splitting the two, we can start with 2012. Here is a look at month-by-month breakdowns of the summers across the US.
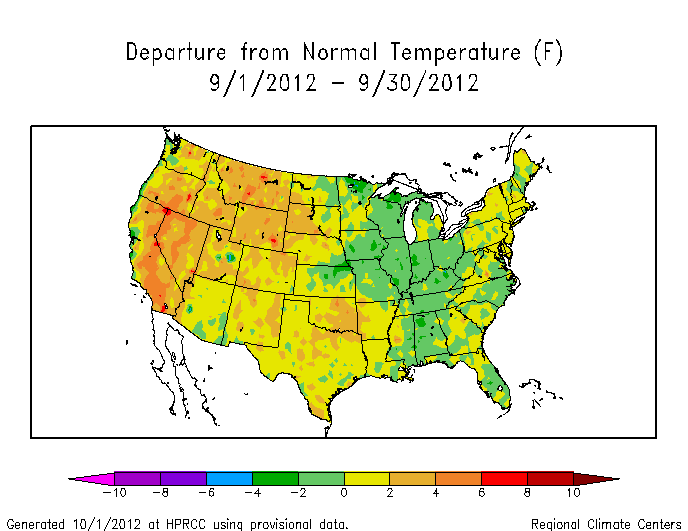
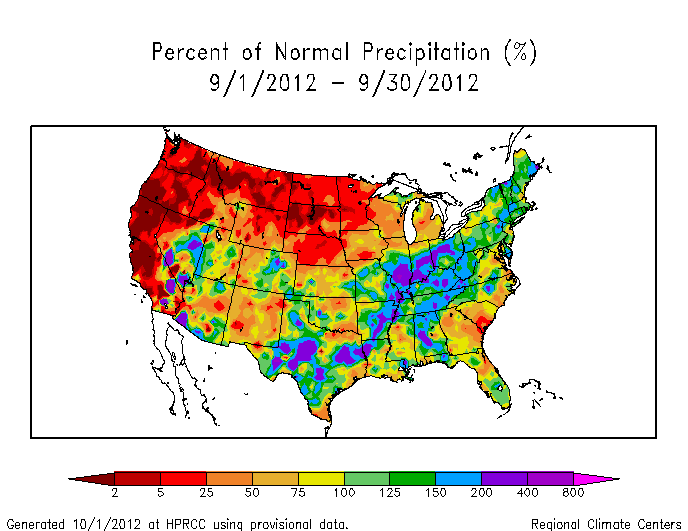
And looking at 2008, we have to pull slightly different maps due to a switch in the way NOAA/NCDC collected and tallied the data.
The takeaway from these two years, given the teleconnections in place, is slightly cooler and slightly above average precipitation.
Karrie Leggett-Brown, at WDAM, used to always ask me in, like, September, “How many hot days do we have left?” And, usually, she meant 93-degree (or warmer) days were left in the Summer.
This season, I wanted to go out on a limb. Because, well, I’m not on TV anymore and I can.
I am going to include in this outlook “hot stretch” numbers. This is a collection of – at least 5 days – where the temperature is warmer than 93F across a majority of the above-outlined area. This is less about 93F at one specific spot, and more about a large area of very hot air.
And I’m calling for only four separate stretches of 93+ days. Two in July, one in August and one in September.
Analog Years: Hurricane Seasons
Since we are talking about seasonal forecasting during the Summer, I know everyone wants to know about Hurricane Season. And let me say, before I go any further, that just because a year is an analog within the teleconnections does not mean that year will be similar for something as specific as a tropical system.
That said, In 2012, there were 19 named storms. The two that probably stick out for people are Isaac and Sandy. While it was an active year, most of the named storms stayed out to sea.
Isaac’s peak intensity was just a Category 1 and dropped between 10-20 inches of rain across parts of the Gulf Coast. There was a reasonable storm surge for the strength of the storm simply due to the size of Isaac.
Back in 2008, there were seven named storms in the Gulf of Mexico. The biggest one of note is likely Hurricane Ike. But Tropical Storm Fay likely impacted the Gulf Coast region this forecast is for more than Ike.
The Bottom Line
The overall seasonal outlook is calling for Slightly Below Average temperatures with Above Average precipitation. This doesn’t mean it will never get hot. This also doesn’t mean it won’t be sunny. This is a general forecast hoping to give a lens to view the upcoming season through.
If you get to August, and it feels like it has been raining more than normal, it is because the season should feature extra precipitation. If you get to September and it seems like it wasn’t as warm as it usually is, that is because it was forecast to be slightly below average.


That’s wonderful (sarcastic, if you have to ask) … above average precip. Right now, I don’t have to wait until September to know it’s above average. The word ‘rain’ has become one of those dirty 4-letter words. If it lasted only a day or two every-other week, there would be no problem with it, but when it just goes on and on for 2 or 3 weeks at a time, it’s almost unbearable.