Being a NickelBlock Froecasting intern can be overwhelming. I’m fully aware. After some chats with former interns, though, I wanted to make a brief post to help walk everyone through the crazy world of some of our data vendors and some of the cool stuff they have to offer (and how to use them in a post)!
STORMVISTA
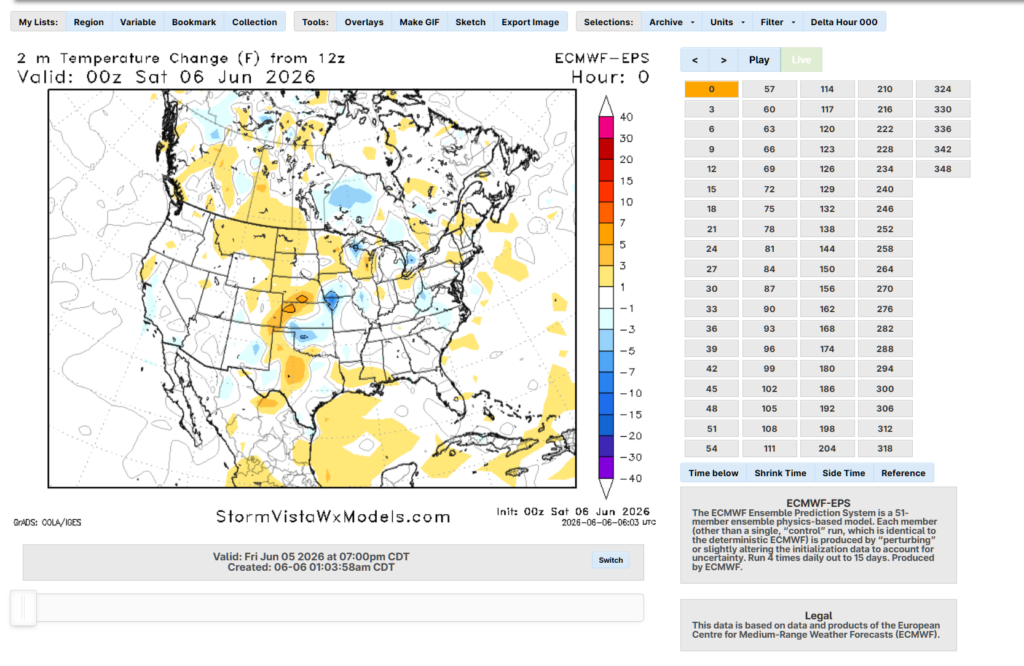
StormVistaWxModels.com has to be the most overwhelming one. They have a TON of data. When you log on you’ll be greeted with this screen:
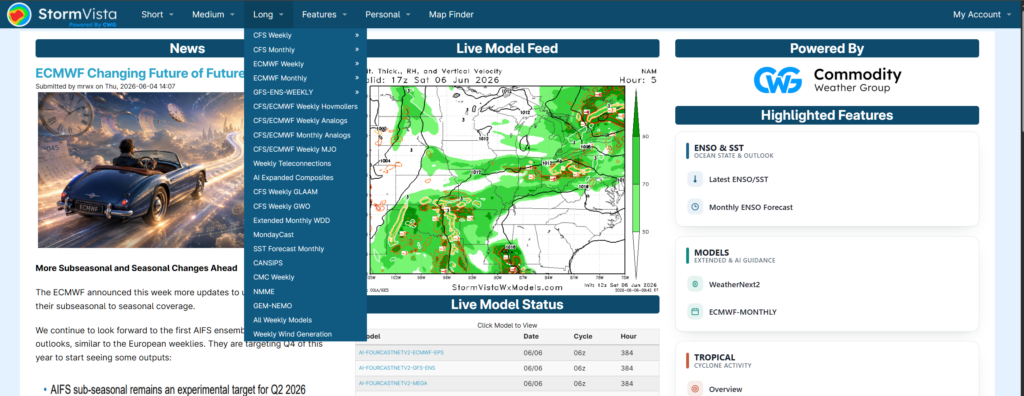
We have a handful of dropdown menus, some posts, and a live model tracker.
The stuff you’ll probably care about most will be in the dropdowns. Particularly the “Medium”, “Long” and “FEatures” sections.
For “Short” and “MEdium” sections, the drop down is basically just a list of the models you have access to use
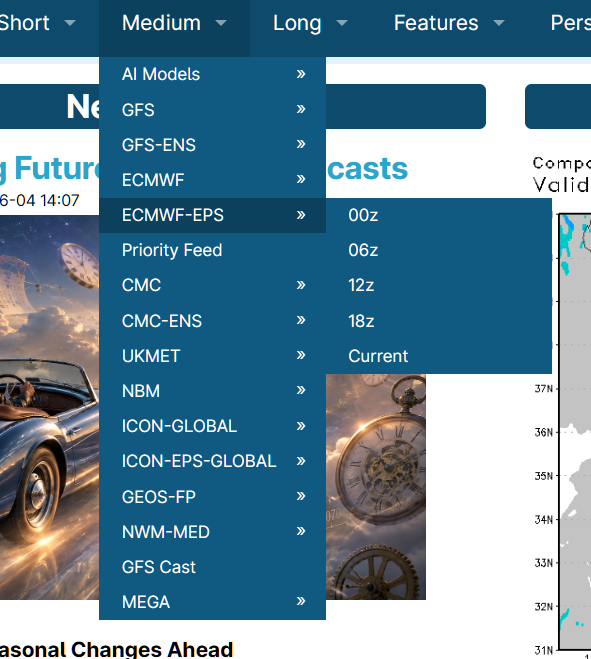
The GFS-ENS and ECMWF-ENS are the big ensemble models you’ll use. And the GFP and ECMWF are the two operational models you’ll also use. AI Models are good, but use with discretion. When you hover over one, it’ll give you the model runs that you can choose.
I won’t dip into these because things are pretty straight forward: You’ll select a model from the dropdown, then a model run (like 00z), and it’l take you to a new page. On that new page, you select a mapped region and then select a variable that is available from that model on that map region.
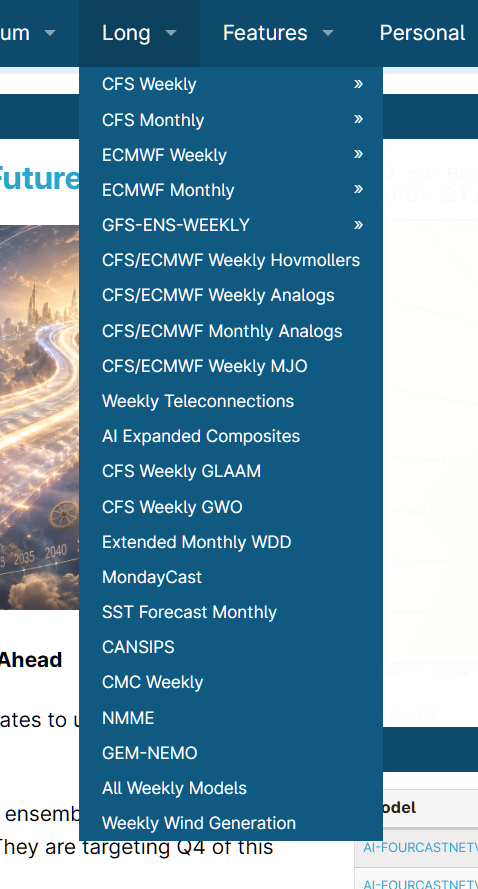
The “Long” section is similar but it has some other fun stuff in there, too.
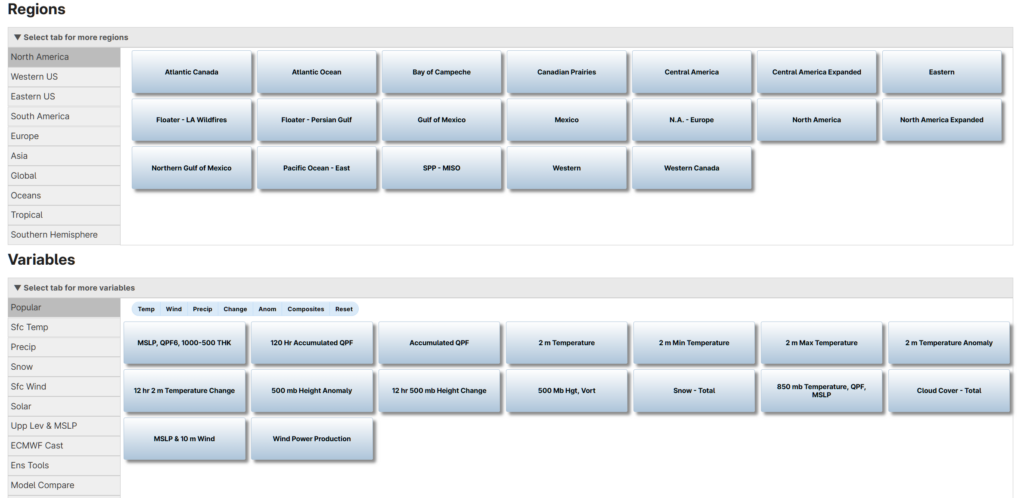
And once you make your selections from these sections for model, region and variable it pops you into the data viewer:
The Features tab, though, may be your best friend. This is where you can find composite maps, tropical maps, model analogs, SNSO updates, City Plots, and the Teleconnections.
The first option you can use, is the composites maps. Tehse work a bit like the model selection process for Short and Medium
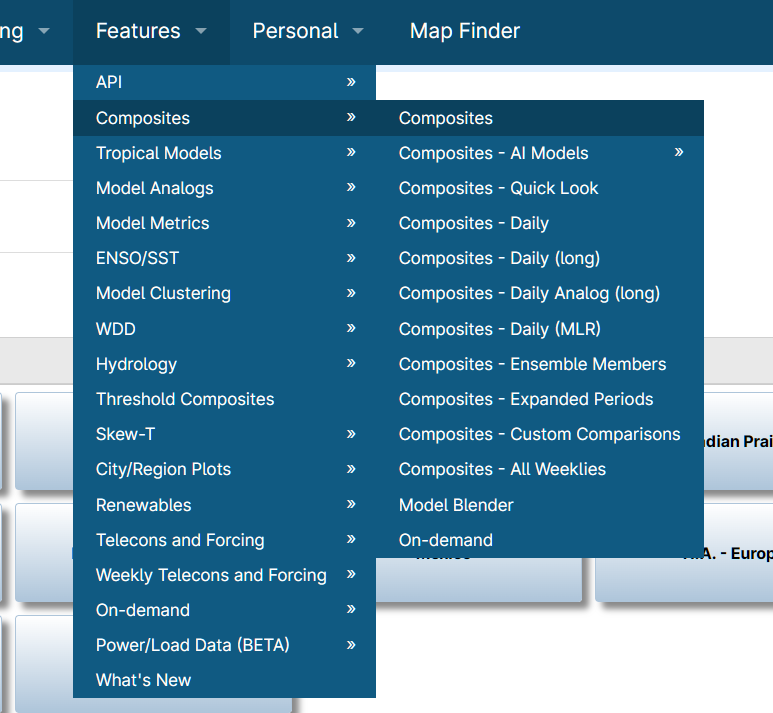
Because it brings you right back here:
The difference is that when you make a selection for a region and a variable, it’ll pop you onto a page that looks like this:
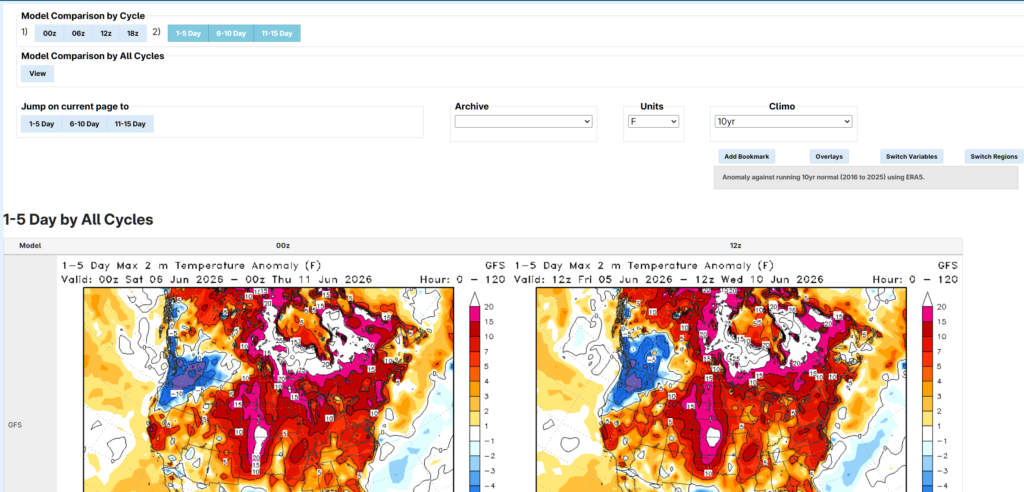
And here we need to make seom more selections. We need to go into the upper left side and select a model run and time horizon (1-5, 6-10, 11-15).
Once you do that, then you’ll get a collection of maps that have the averaged values across those time domains for all available models
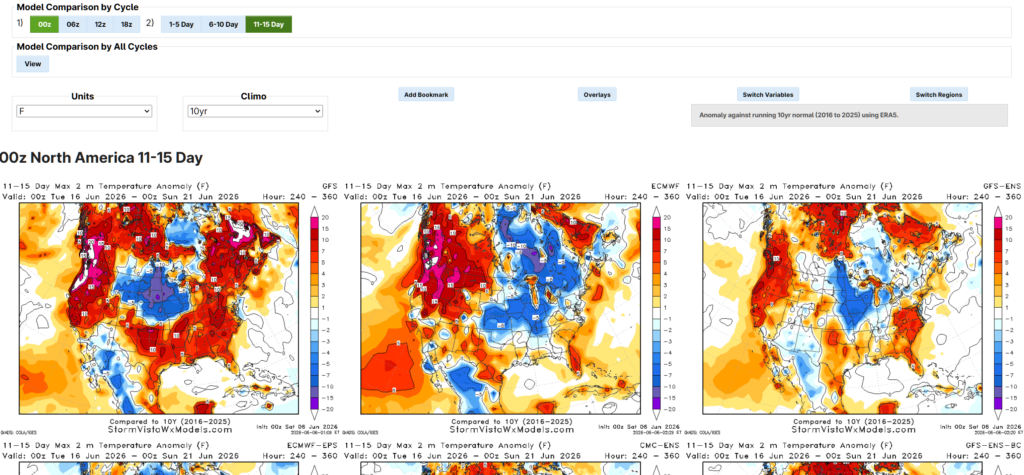
So, when you’re looking at your “Extended Range” for example, you could use the “6-10” window and the “11-15” window to show maps that help support the data shown in the 15-day forecast graphic. And explain to folks why you believe – or don’t believe – what the models suggest.
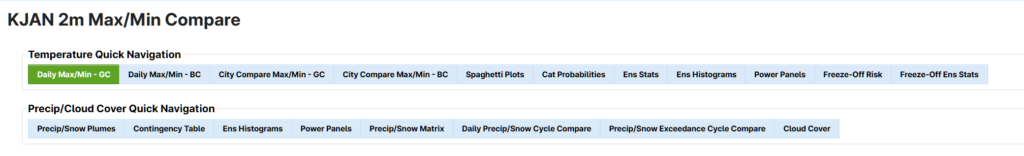
Then there are the City Plots. These can be very helpful for your local and regional forecasts if you want some graphics to support what you’re forecasting or if you just want a good sanity check on numbers.
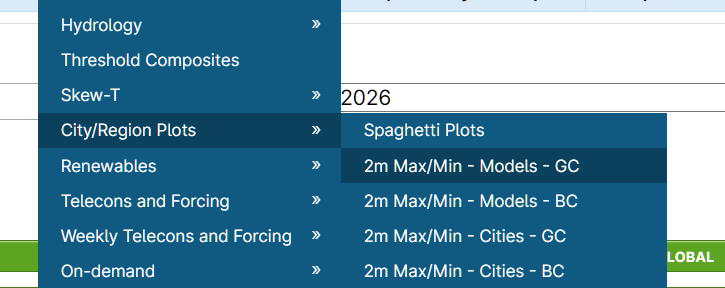
The difference between GC and BC here is important, but both work for what you are trying to get done. The BC is the Bias corrected data. So the researchers at STormVista have tried to correct the models bias for each city (urban heat island, coastal influences, etc).
The other option, GC, is Grid Corrected data. This is where they try to correct for cities not falling perfectly on the gridded model data. For exmaple, a 6km model may not have a specific datapoint on top of Jackson, Mississippi. So they try to “Fix” that by blending the data more specifically for that location. .
PErsonally, I like the Grid Corrected data. So this is what that looks like:
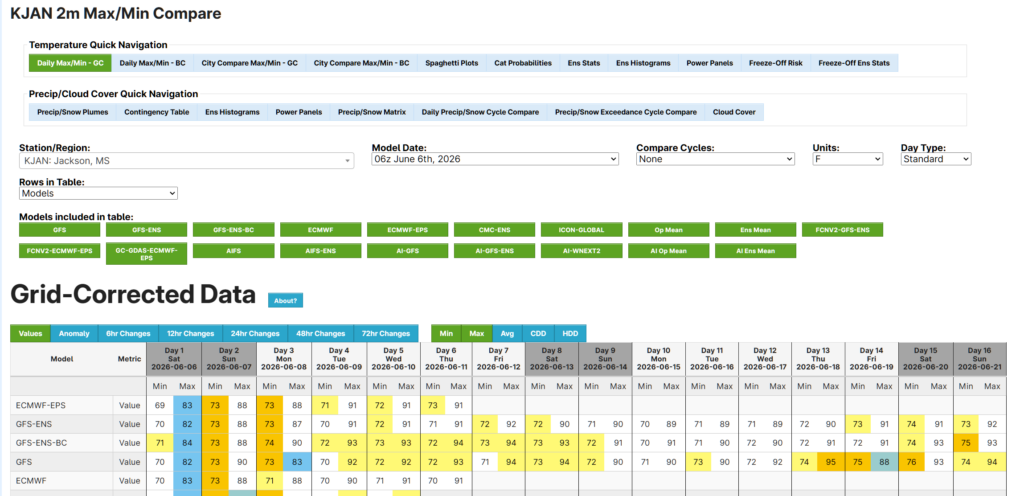
And you have all kinds of data to select from on this page. And so much more to get to on the menus up top.
I would really encourage you guys to click around on these pages for multiple cities to see what is there.
METDESK
(These guys are new! ….more to come!)
METEOMATICS
Using MEteomatics is much, much different. These guys don’t offer maps. They offer data. And it is up to you to produce something with it. The nice thing about that is it gives you the freedom to create!
Here is a list of all of the parameters they offer…. It is a LONG list.
Head over to https://api.meteomatics.com
If you’ve never worked with an API before, don’t worry. The goal is not to memorize a bunch of codes and syntax. Instead, focus on understanding the structure of a request. Once you understand the building blocks, you can usually figure out how to modify an existing query to get the data you need. Plus! Meteomatics provides a URL Creator tool that can build requests for you. Even experienced users (me) rely on tools like this rather than memorizing every parameter and option.
Think of an API as a way to ask a weather database a question. You build a URL that tells Meteomatics:
When you want the data
What weather variable you want
Where you want the data from
How you want the data delivered
As Jef pointed out in his quick presentation, a typical Meteomatics request looks like this:
api.meteomatics.com/time/parameter/location/formatWhere the time is in Zulu/UTC and looks like this: 2026-06-06T00:00:00Z
Or you can select a time range like this: 2026-06-06T00:00:00Z–2026-06-09T00:00:00Z:PT1H where the “PT1H” part is basically saying, “Pick Timing at 1 Hour intervals”
Then you ant to pick a parameter… Stuff you might use is:
| Parameter | Meaning |
|---|---|
t_2m:C | Air temperature (°C) |
precip_1h:mm | Hourly precipitation |
wind_speed_10m:ms | Wind speed at 10 meters |
wind_dir_10m:d | Wind direction |
msl_pressure:hPa | Mean sea-level pressure |
You can request multiple variables by separating them with commas: t_2m:C,precip_1h:mm,wind_speed_10m:ms
Then it is time to pick a location (or multiple locations) using lat-lon points. For Hattiesburg, it might be 31.3271,-89.2903
Then we choose an output format. For the most part you’ll use csv or html, depending on what you want to do with the information. And if you choose html, know that you can download the data via csv afterward fromt eh chart it shows you. So, if you goof, there is still a way to get the raw data.
In this case, our API call web address looks like this:
api.meteomatics.com/2026-06-06T00:00:00Z/t_2m:C/31.3271,-89.2903/html
Or we can look at multiple variables across a period of time like this:
api.meteomatics.com/2026-06-06T00:00:00Z–2026-06-09T00:00:00Z:PT1H/t_2m:C,precip_1h:mm,wind_speed_10m:ms/31.3271,-89.2903/csv
If you’re thinking, goodness, that is too complicated, don’t worry… You can use the URL Creator!
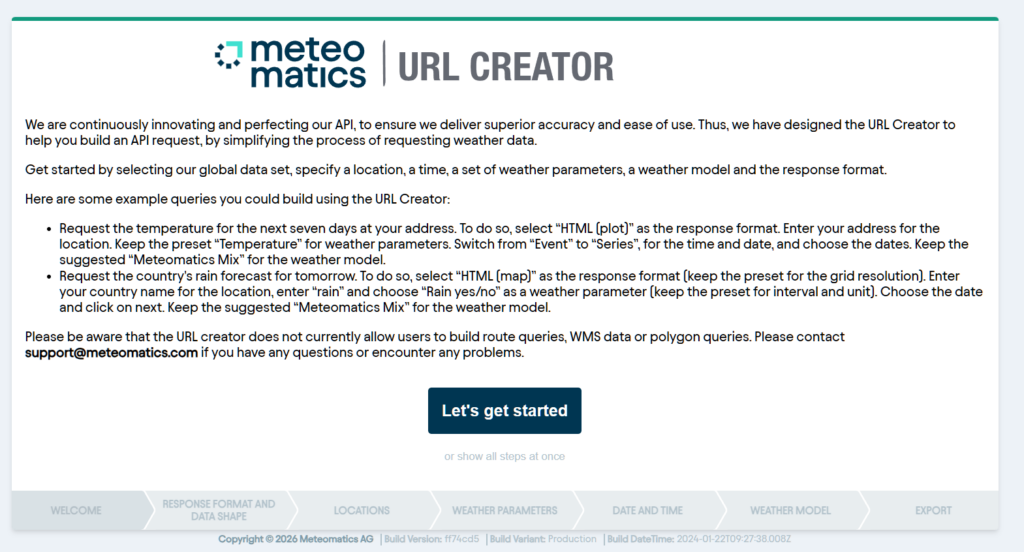
This is a pretty intuitive walkthrough that guides you through creating an API call weblink and then, if you choose, can take you to the data you’re looking for.
For example, lets say you want some csv data:
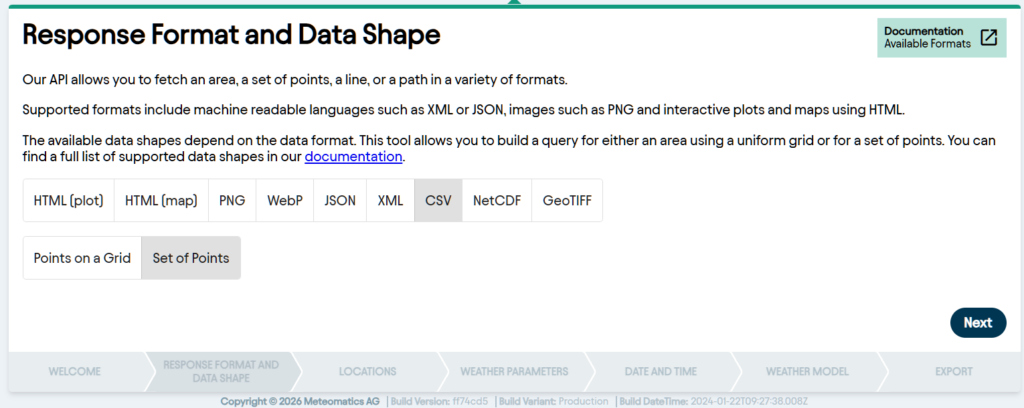
Select that and then select a set of points. We don’t want to use points on a grid.
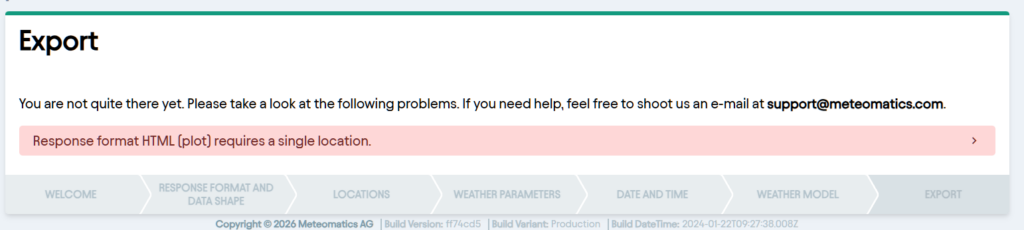
Worth noting, if you select “html” here, and then select multiple points, you’ll be greeted with this error when you go to export. For multiple points, use a “csv” format.
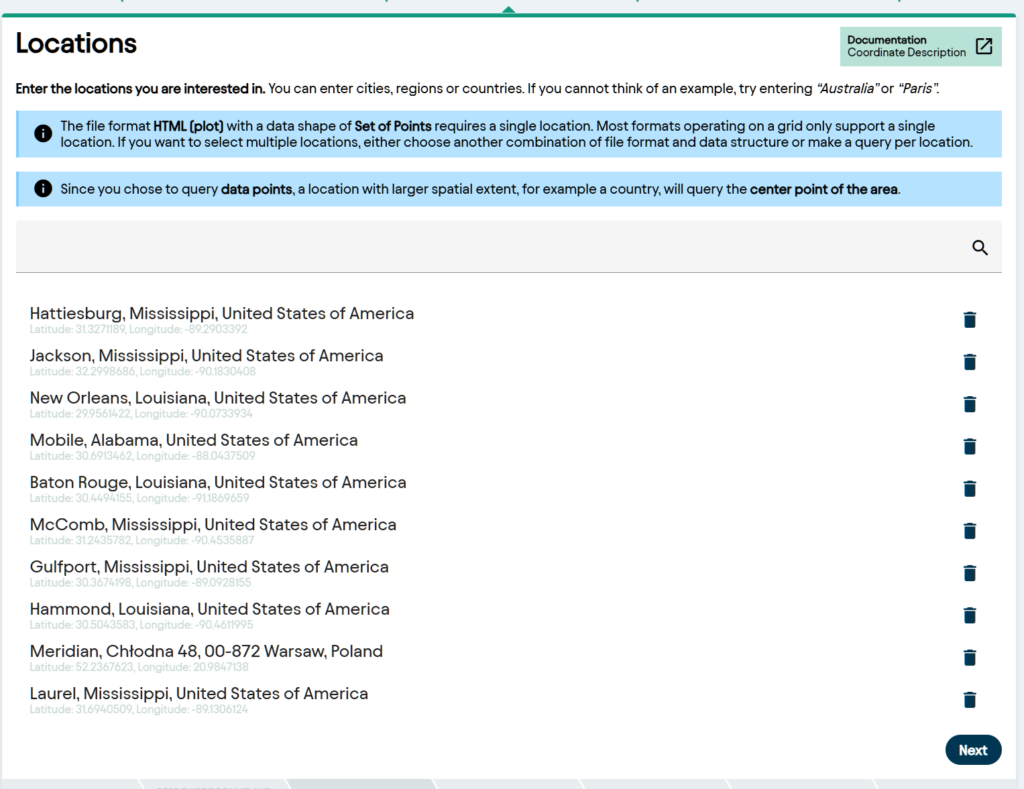
Then, you can list out the (up to 10) location(s) you want data for:
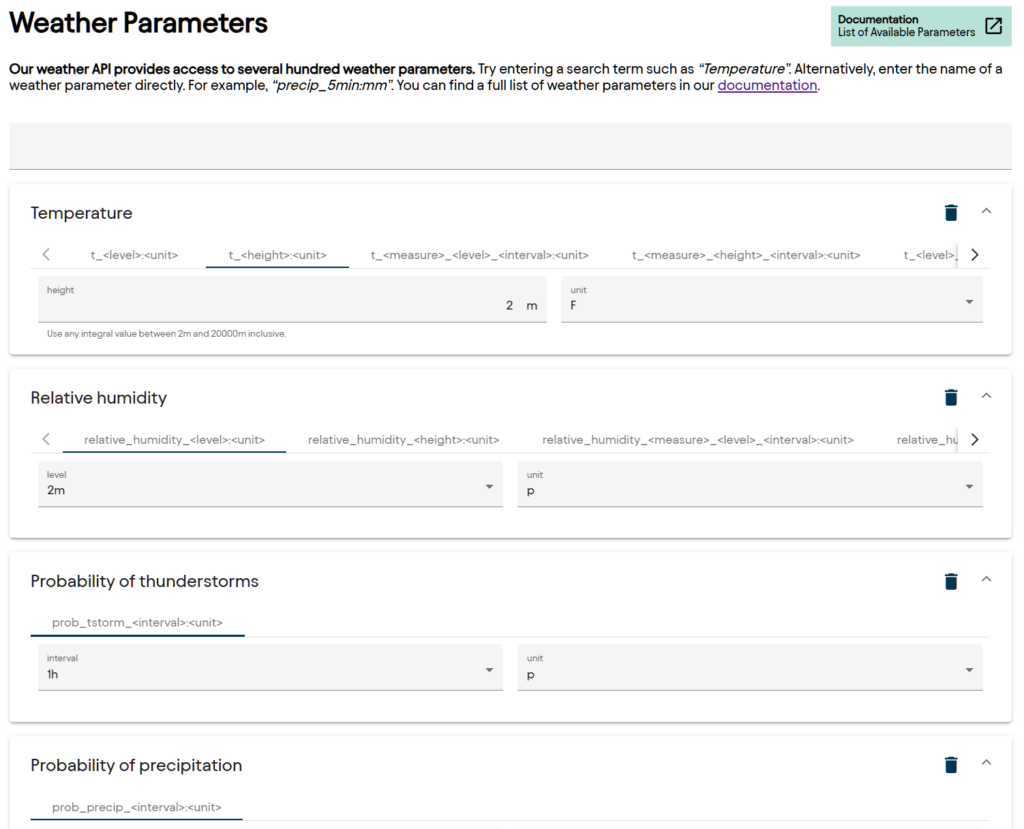
Then select the (up to 10) parameter(s) you are interested in viewing:
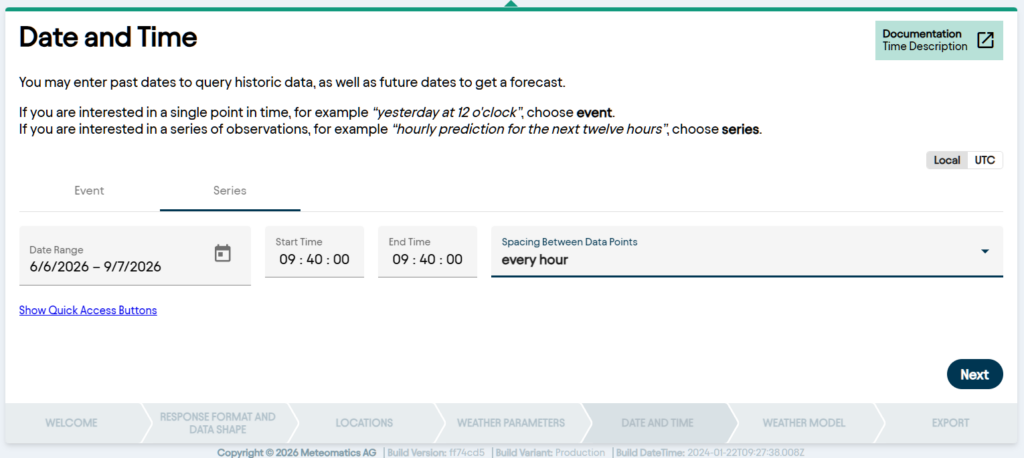
Then select the timeframe and time interval. Best to select “Series” to view data into the future. Here i am looking for the next three months of data at an hourly increment.
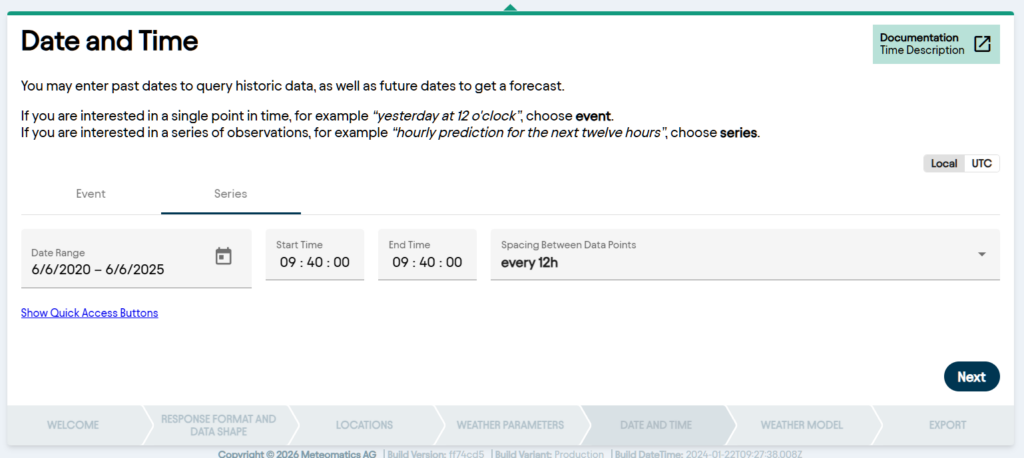
But you can also look backward in time
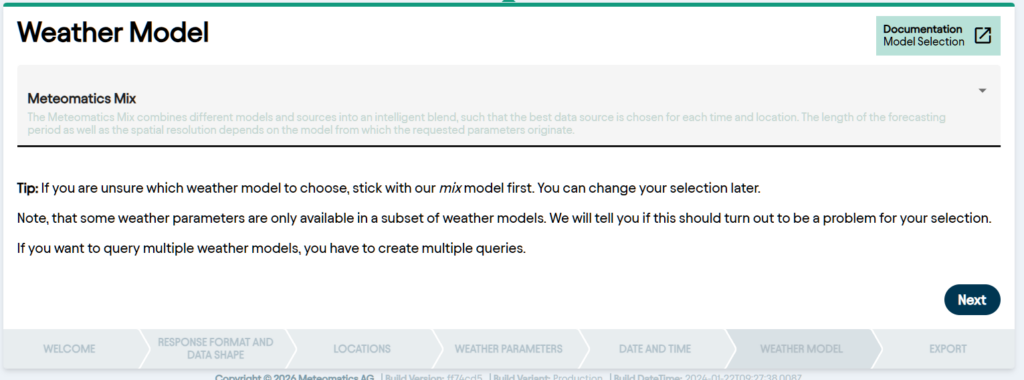
Tehn, select the model you want to use
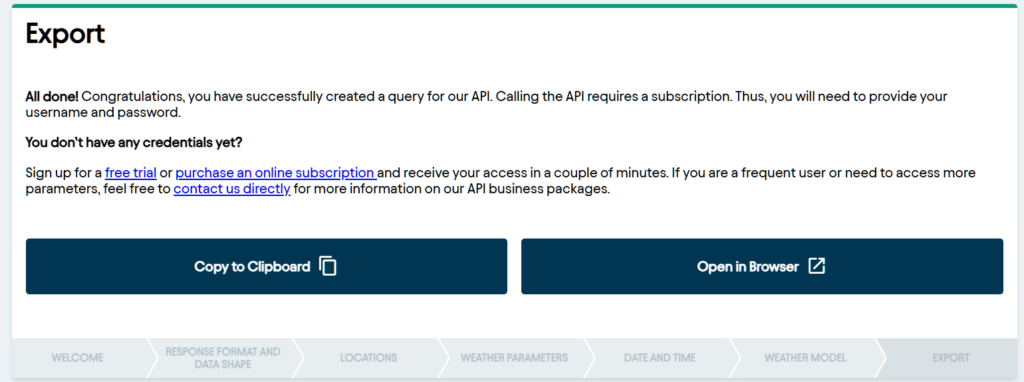
And -BAM!- you have access to your data! You can copy the weblink to your clipboard and input it into the address bar yourself, or just open in a new browser. If you chose a csv file, it will simply download thefile for you. For an html, it’ll take you to the page with a chart on it.
Now, what you do with this particular data is for another post!

