A headline I never want to write. But the evidence that we are ramping up for an active period in the tropics is starting to really mount and the evidence that most of that activity may end up near or in the Gulf of Mexico is also starting to pile up.
WHAT DOES THIS MEAN FOR YOU
I’ll explain all the details below, but I wanted to cut the chase first.
In short: Double-check your Hurricane Prep kits, make sure you know your evacuation routes (if needed), and know the steps you would take to prepare for a landfalling tropical system near you (be it a Tropical Depression or Cat 5 Hurricane).
This does not mean that a big bad Katrina 2.0 is definitely going to hit the Mississippi coast next week. What this does mean is that model data suggests that, statistically-speaking, the chances for some sort of tropical system impacting the Gulf Coast is higher than the climatological average during the next three weeks. And climatological average is already at its peak during the next six weeks as it is the peak of Hurricane Season.
Why is this?

THE MATH
Historically speaking, the peak of Hurricane Season is early September. You have probably seen this chart plenty of times:
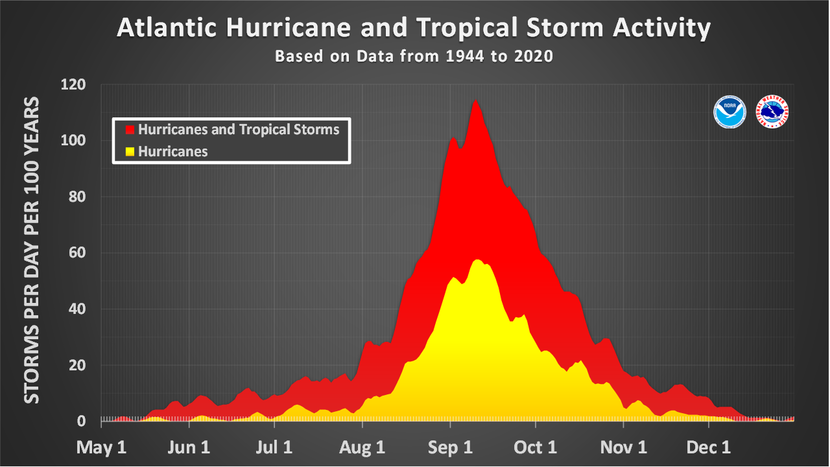
Notice that we run pretty low and flat through the end of July and the spike pretty quickly through August and into mid-September.
This is the natural progression of any given hurricane season.
But, recall my forecast from back in May, this Hurricane Season was forecast to look like the Hurricane Seasons from 2002, 2003, 2007, 2009, 2013, and 2014.
Looking back at the numbers for those years:
| In August | In September | In Gulf | % Storms in Gulf | |
| 2002 | 2 | 8 | 6 | 60% |
| 2003 | 2 | 5 | 4 | 57% |
| 2007 | 4 | 8 | 5 | 42% |
| 2009 | 4 | 3 | 1 | 14% |
| 2013 | 3 | 5 | 3 | 38% |
| 2014 | 2 | 2 | 1 | 25% |
| 6 YR AVERAGE: | 40% |
That shows that during those 6 years, 40-percent of the tropical systems (tropical depression, tropical storm, hurricane) that developed during August and September, ended up in the Gulf. Six of those systems were Hurricanes, and two were Major Hurricanes.
And when you compare six years with six Hurricanes (two as Major Hurricanes) making landfall across the Gulf Coast against the average return period across the Gulf being between 5 and 15 years, you can see how the potential for storms during this August and September impacting communities across the Gulf is statistically higher.


The return period for our area is between about 5-12 years for a Hurricane and between 14-26 years for a Major Hurricane.
So, putting our specific ‘analogous years’ aside, let’s just look at a list of all of the landfalling hurricanes in our area during the last decade:
2022 – None
2021 – Ida (Major Hurricane)
2020 – Sally, Delta, Zeta (Major Hurricane)
2019 – Barry
2018 – None
2017 – Nate
2016 – None
2015 – None
2014 – None
2013 – None
Notice that we have had five during the last 10 years, but all of them were between May of 2019 and October of 2021. That includes two Major Hurricanes. So, things are rarely evenly distributed. This is why I rarely take comfort in the statistics that “Oh, well, we only see a Major Hurricane every 20-some years” because we rarely see it actually fluctuate over 20-something years.
THE FORECAST DATA
Looking forward, the model data seems to suggest a flurry of action coming off the coast of Africa where, recently, it has been rather quiet. Below, on the left is the rainfall compared to normal during the last 7 days,. And on the right is the forecast for rainfall in the coming week.


Most, but not all, of that rainfall will eventually emerge off the African coast as tropical waves.
Those waves may struggle to develop as they traverse the Atlantic, though. This is still an El Nino year, even if it is a weird El Nino year. So there will be some shear in place to help mitigate development. On top of that, the MJO won’t be friendly, either, still showing supression over the Atlantic Basin.
That said, looking out a bit further in time, and the MJO will eventually look a bit more favorable.

In the short term, though, the favorable environment is going to be farther west in the western Caribbean and Gulf of Mexico. And out into the eastern Pacific.
What also becomes more favorable in the short term (during the next week)? Parts of the upper atmosphere. Model guidance shows lower heights across the Gulf and Caribbean as well as lower shear in the Gulf and parts of the Caribbean.

Far from a slam dunk, but certainly an eyebrow raiser for a meteorologist.
And the models are also picking up on all of this and kicking out guidance that shows systems actually developing.


These two models are manifestations of the combination of more rain in Africa, more waves coming off the coast, the MJO suppression moving out, and the atmosphere becoming generally more favorable for development. Five days ago these maps barely had any lines.
The other reason I think the Gulf is more in play is the overall arrangement of the atmosphere across teh Atlantic is pointing everything toward the Gulf during the next two weeks.


Above on the left, the weakness begins to develop as we move through the 11th-to-16th window. Then, above, on the right, the weakness is in full force between the 16th and 21st. Then as we move out and toward the end of the month, we see that same weakness, and lower heights, on a completely different model when looking at the forecast for Week 3.

Looking at Week 4, and we can do that in a ton of different ways, shows this weakness continuing, but a bit more muted as the pattern tries to reorganize itself. That said, once we start looking out that far, specifics get really, really fuzzy – even at the ‘big picture’ level.
THE WATER IS VERY WARM
About three weeks ago I showed this image of the depth of the 26-degree Celsius isotherm.

Up top is the depth of the isotherm on July 18th. And on bottom was the depth on July 18th, 2022. Everywhere in green is a depth of greater than 40m. The 26C Isotherm is a great indicator for “can the water help develop and sustain a Major Hurricane. The specific depth needed can be debated, but once you get to about 50m in depth there is plenty of stored energy for a Major Hurricane. Especially given the potency to which the temperature is above 26-degrees celsius. It isn’t 26.1C at the surface, it is closer to 30C. Or in some cases 33C.
Yellows are 100m. Reds are 150m
You can think of this as “How much food is there for a Hurricane to eat?” The deeper the isotherm, the more food the Hurricane cat eat to grow big and strong.
Let’s look at a zoomed in map of today’s readings.

That black splotch is a depth of greater than 200m. Literally off the scale.
A not-great-but-usable comparison for the Gulf specifically shows that back in 2020 when meteorologists all thought, “the Gulf is as warm as we’ve ever seen it” it was showing very similar, albeit slightly more uniform, warmth. But the peak warmth and depth of that warmth wasn’t quite as high (or deep).

So, suffice to say, there is plenty of food out there for any tropical system that wants to develop to show down on and “grow up to be big and strong.”
THE BOTTOM LINE
Like I said all the way up top: this is a good reminder that we need to make sure we have our plans in place. Know what to do if you need to evacuate, and have all the supplies necessary should a tropical system move toward you.
No one can tell you if a hurricane will hit your house more than a few days out. So it is best to simply be preapred so if that happens, you have all of your ducks in a row earlier rather than later.


