Good morning and Happy Saturday, folks!
As August comes to a close and we enter the most active month for the Atlantic Hurricane Season – it sure does feel like something is missing – literally any interesting weather in the Tropics. That’s right, there have been an (un)impressive 0 hurricanes, 0 tropical storms, and 0 tropical depressions so far this month. In fact, this year has been one of the least active hurricane seasons thus far since modern records began.
So How Slow is this Hurricane Season, Really?
Warning: Math and Meteorological Jargon
One of the ways to measure the activity of a hurricane season is to calculate the season’s ACE, accumulated cyclone energy. Unlike most equations in meteorology, this one isn’t even that bad – for each tropical cyclone, you square the storm’s sustained wind speed at 6-hour intervals and sum them all up, then divide by 10,000.
If you don’t think I’m about to calculate the ACE for each storm this season you’re sooo wrong.
So far this year, there have been three tropical cyclones, all of them tropical storms (having maximum 1-minute sustained winds between 39mph and 73mph): Tropical Storm Alex, Tropical Storm Bonnie, and Tropical Storm Colin.
Tropical Storm Alex
Tropical Storm Alex was first designated as Potential Tropical Cyclone One, a designation that the National Hurricane Center uses when a disturbance is potentially a tropical storm, but it is unclear if it meets the specific criteria – most commonly, a closed circulation around the storm’s center. It was designated as Potential Tropical Cyclone One at 2100 UTC (4:00pm CDT) on June 2, and travelled across Florida still as a Potential Tropical Cyclone on Saturday, June 4 until it was officially named Tropical Storm Alex at 0600 UTC (1:00am CDT) on June 5. Alex continued eastward toward Bermuda as a Tropical Storm, reaching maximum sustained winds of 70mph, just 4mph short of hurricane-strength, before eventually loosing tropical characteristics at 2100 UTC (4:00pm CDT) on June 6. All-in-all, Alex was a tropical storm for just over a day and a half, and racked up a total ACE of 1.8
Tropical Storm Bonnie
Much like Alex, Bonnie was first designated as Potential Tropical Cyclone Two as it moved across the Main Development Region of the Tropical Atlantic starting late on Monday, June 27. Despite Tropical Storm Watches and Warnings being hoisted for many islands in the Lesser Antilles and the northern shores of Venezuela and Colombia, PTC2 wasn’t officially named Tropical Storm Bonnie until 1500UTC (10:00am CDT) on July 1, just 12 hours before making landfall near the Costa Rica/Nicaragua border with maximum sustained winds of 50mph. This puts Bonnie’s ACE at a measly 0.7.
Tropical Storm Colin
Lastly and certainly least was Tropical Storm Colin, a storm that pretty much came out of nowhere, as many were focused on Bonnie crossing over into the Pacific Basin after surviving landfall in Central America. Colin formed just onshore of South Carolina at 0900UTC (4:00am CDT) on Saturday, July 2, with the NHC issuing Tropical Storm Warnings for parts of the South Carolina and North Carolina Coasts. Just as quickly as it formed, however, Colin weakened to a Tropical Depression by 11:00pm EDT (10:00pm CDT) the same day, and only attained a maximum sustained wind of 40mph. This puts Colin’s ACE at an even more unimpressive 0.4.
So What’s the Big Idea???
So, if you add up the ACE for the entire season. That is… 1.8 + 0.7 + 0.4, you get 2.9 (if I didn’t round we’d end up with 2.8, but the point still stands…). But really, this number is completely meaningless without context. Well, according to Colorado State University, our average ACE by this time of year is 28.4. So, to help you visualize this better, here’s a nice graph that compares this season’s ACE with the climatological average.

If you squint hard enough to see the pale blue line all the way at the bottom of the graph, you can start to see just how inactive this season has been…
It doesn’t look like the Atlantic is going to stay quiet for much longer, however. Multiple signs point to an increase in activity in the Atlantic Basin beginning as early as next week, with the National Hurricane Center already watching a few disturbances as they traverse the Main Development Region.
So, without further ado, let’s jump right into my final (and probably the most important) tropical weather forecast.
What the National Hurricane Center is Watching
I always like to start with what the National Hurricane Center is watching, as it’s a great start for the systems we need to keep our eyes on.

At the moment, the NHC is watching two disturbance for chances of becoming tropical cyclones over the next five days. From east to west, the first disturbance is currently located north of Venezuela and the ABC islands and has a near 0% chance to develop in the next 2 days and a 20% chance to develop in the next five days; the second disturbance is located a few hundred miles west-southwest of Cape Verde and is given a 10% chance to develop in the next 2 days and a 30% chance to develop in the next five days.
Before we get into any individual systems, let’s set the stage by look at the current conditions in the Atlantic Basin.
Current Conditions in the Tropics

If we take a look at the infrared imagery of the Atlantic Basin, we can see pretty clearly the large areas of convection associated with Disturbance 2. For Disturbance 1, it’s much more difficult to make out, especially as much of the associated convection is over land at the moment.

Looking at water vapor imagery though, it isn’t hard to see why Disturbance 1 is struggling at the moment. Apart from the oh-so-typical dry air associated with the Bermuda High in the middle of the Atlantic Ocean, Disturbance 1 is fighting some drier air, shown by the shades of yellow. Disturbance 2 on the other hand, has managed to fight off some of the drier air thanks to nearly constant convection firing off in the wave’s rather large diameter.
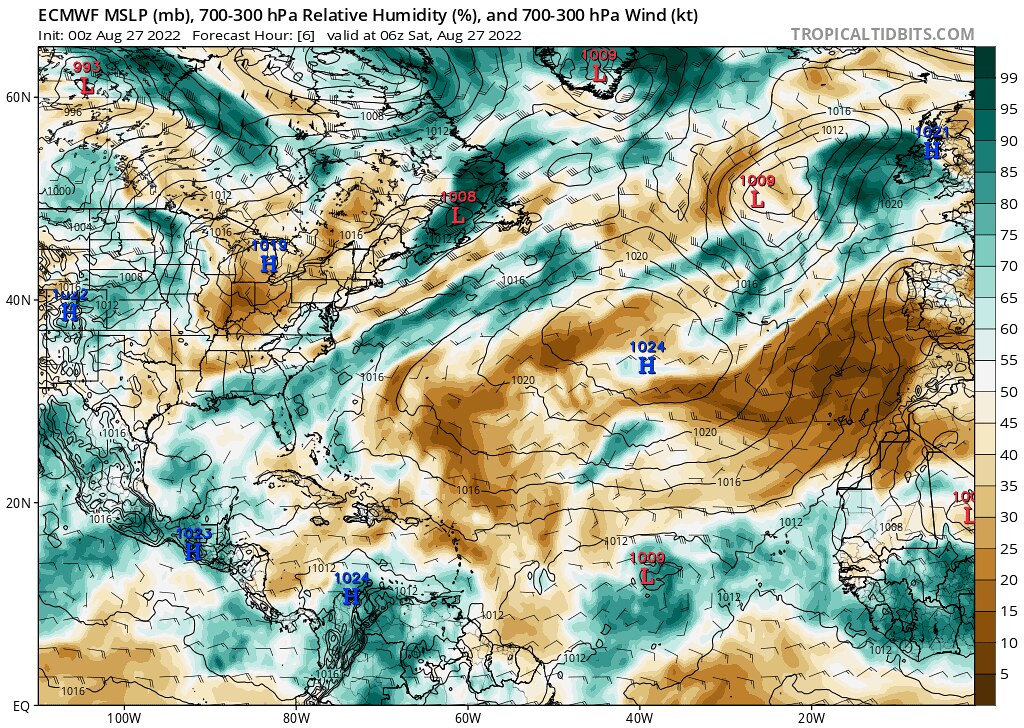
The 00z ECMWF run from this morning seems to have a much better handle on the moisture situation, with just enough moisture in the mid- and upper-levels of the atmosphere to keep Disturbance 2 afloat, and too little moisture for Disturbance 1 to fire off any convection…
As far as shear goes, this is where Disturbance 1 gets the upper-hand…

At the moment, Disturbance 1 is in a favorable environment with respect to wind shear, with a broad anticyclonic wind shear pattern in the overhead, a situation that typical promotes the growth of tropical systems. Things are not looking so hot for Disturbance 2, however, as the wind shear remains quite high at the moment, likely preventing the storm from getting better organized sooner…
Anyway, now that we’ve taken a look at the moisture and shear in the tropics, let’s take a closer look at what the models are showing for the disturbances’ future. We’ll start with Disturbance 1 first, as its closer to home, and then we’ll cover Disturbance 2’s prognosis.
Disturbance 1
Currently fighting off some dry air and almost void of convection, this disturbance isn’t looking too hot at the moment. However, like I just said in the previous section, shear is not a problem for this system at the moment, and if convection were to fire up anytime soon, it won’t take too long for it to organize and start to develop into a tropical cyclone.
Just like in my last discussion, models still are not so sure just where this storm will go and how strong it will be. The European model has the storm struggling to get its act together due to the dry air in the region.


By Tuesday morning, the European model shows the disturbance still failing to form a closed circulation, albeit being able to moisten up the environment somewhat. In this particular model solution, the disturbance moves ashore over Central America and into the Pacific Basin, never organizing into a tropical cyclone in the Atlantic.
The American GFS model, on the other hand (and once again), has a much different solution…
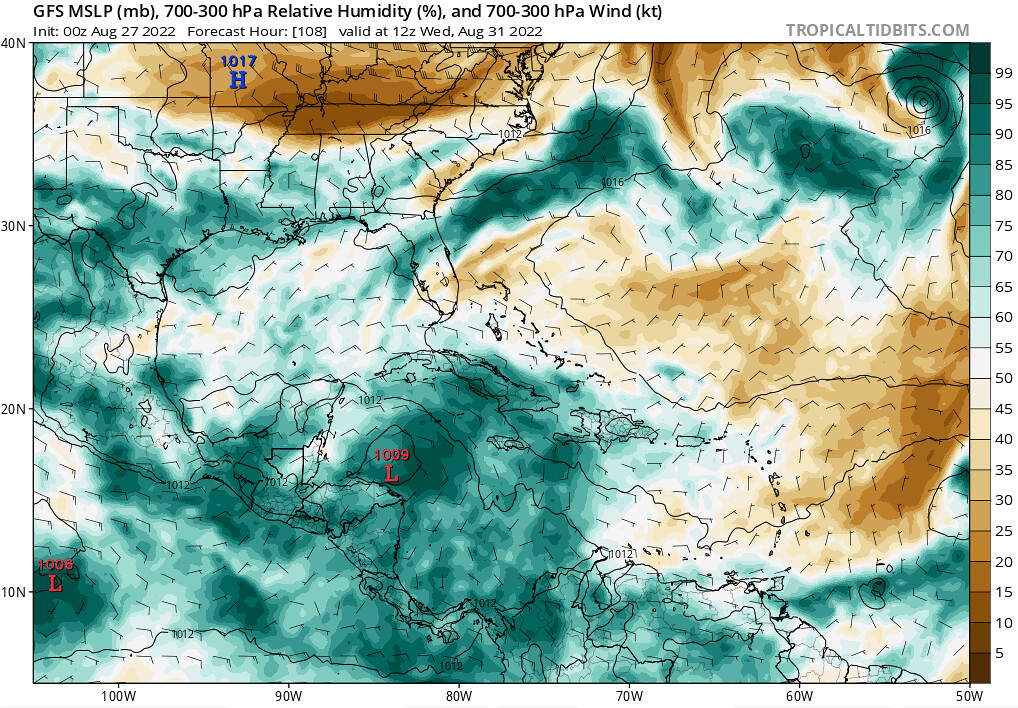
By Wednesday morning, this GFS model run has the system being able to moisten the environment much more than the ECMWF run, allowing it to form a closed circulation and actually hook northward toward the Yucatan Peninsula. After making landfall near Cancun late Thursday night, the cyclone continues onward in the southern Gulf of Mexico and makes a second landfall, this time as a strong Category 2 hurricane north of Tampico, Mexico next Sunday.

Once again, there is significant model spread between these two solutions, which the ECMWF not even forming a tropical cyclones, and the GFS depicting a strong hurricane making landfall in Mexico. This just goes to show the high level of uncertainty with this storm, and we’ll have to wait and see how this disturbance will adjust to the dry air in the environment. I would like to point out, however, that the ECMWF does, at the time of writing this article, have a better hold on the dry air that this system is experiencing at the moment, which makes me favor the ECMWF solution a bit more at this time. But, much like what I said in the last Tropical Forecast, as we get closer in time to the potential development of this storm, the model confidence will increase as well, giving us a much better idea of what will happen with this system.
And on that note…
Disturbance 2
This disturbance, which already has a surprisingly well-defined appearance on infrared for such a broad Easterly Wave, is also something we need to keep our eye on. While the moisture isn’t so much of a problem at the moment, as the storm is able to sustain convection, the relatively high shear over the system is certainly not helping it develop into a tropical cyclone anytime soon.
This time, let’s start with the GFS-evolution of the storm. By the middle of next week, the shear over the region will have weakened, but the storm’s west-northwesterly track will move it into the drier air associated with the Bermuda high.


On this model run, the dry air eventually gets the best of the system, and it is not able to recover, as the system dissipates by the beginning of the following week. On a side note, the GFS also tries to develop an additional tropical cyclone from an African Easterly Wave exiting Africa, but we’ll deal with that another time…
The ECMWF, though, has a different plan for this system. While both model runs start out similar, with the ECMWF showing a decrease in shear and some drier air getting close to the storm’s circulation, the 00z run of the Euro does not allow the drier air to get the best of the storm.


The ECMWF allows the storm to develop a tighter circulation before the drier air can intrude, and eventually the Euro solutions depicts the storm as a strengthening hurricane as it approaches the Bahamas.

So once again, there are some pretty big disagreements between the ECMWF and the GFS operational runs, which just goes to show the level of uncertainty here with this system.
Conclusions
Just like what I said earlier this week in my previous Tropical Discussion, it is just too far out to tell with a reasonable amount of confidence whether or not these disturbances will strengthen into tropical cyclones and affect land, or if they’ll struggle to develop and eventually fall apart. The fact that some models are showing that these storms will indeed develop into tropical storms or hurricanes does raise the level of concern, as it shows that the possibility is certainly there for these systems to get their act together mess some stuff up. As I mentioned earlier in this discussion, the only way to get more confident in a forecast is to wait until it is closer to the actual event, so hopefully going into Monday and Tuesday, we’ll know a lot more about the future of these two systems.
Even with all that being said, this is the first time in a while this summer that the models have consistently shown multiple disturbances where development into a tropical cyclone is possible – so it’s safe to say that, even after this wicked slow start, the Atlantic Hurricane Season is finally waking up. So now it’s more important than ever to keep our eyes on the tropics and to monitor the situation as new model data arrives.


Great work! Thanks!!