Good morning, folks! What a scorcher it was yesterday… Columbia, Hattiesburg and Laurel all joined the century club with afternoon highs of 100F, but Meridian took it a step beyond as the mercury rose to 102F for a brief period around 3:25 PM!
There was one saving grace, however, the air was noticeably drier today than it has been earlier this week. In fact, at the time at which the high temperature was recorded, the dew point in Columbia was 68 F, with 64 F in Hattiesburg, 61 F in Laurel and only 52 F in Meridian. Admittedly, dew points in the 60s are still a bit uncomfortable, but that 52 in Meridian must have felt great (if we ignore the fact that the temperature got to 102F).
By the looks of things, we’ll only have to endure just one more day of sweltering heat before a pattern change brings the chance for showers and thunderstorms and cooler temperatures by Sunday, continuing through the end of the week.
Brief Synoptic Overview
Let’s start with a mid-level water vapor satellite image of the CONUS to see what we’re working with synoptically…

From west to east, we can see that an upper-level low is situated over the Northern Rockies, a large ridge is (still) sitting over the South, and a smaller upper-level low is located off the Mid-Atlantic Coast. One interesting feature that I’ve marked on this map is a small surface low moving into Texas, discernable from the counterclockwise flow visible on the water vapor imagery.
While this feature isn’t much, it did help keep the dew points relatively high in parts of Louisiana and western Mississippi courtesy of a gentle southerly flow off the Gulf of Mexico.
Another feature to note is the the interaction between the upper-level low over the Northern Rockies and the upper-level ridge and the resulting plumes of green indicating water vapor lofted higher into the troposphere from parts of Nebraska northward through the Dakotas and into Canada. The plumes of water vapor higher in the atmosphere are a sign of some unsettled weather, in this case some thunderstorms transporting moisture from the surface vertically.

Taking a quick peak at sea-level pressure, we can see a peculiar pattern in the easternmost 2/3 of the country, with relatively high sea-level pressure in the eastern third and general troughiness in the Great Plains, corresponding well with the region of unsettled weather in the northern Great Plains. These features will become more relevant later in the discussion.
Talkin’ About the Ridge

As of the time of writing, the mid-level high pressure that’s been responsible for these above average temperatures is still parked over the region, imparting synoptic-scale northerly winds for Southeastern Mississippi and Southwestern Alabama, as shown by the isohypses and the wind barbs in the image above. Upon analysis of the nearest atmospheric sounding (from Jackson), we can see that this high pressure means business.

Even at 7 PM, the time the sounding was launched, the temperature in Jackson was still 95 F.
Ouch.
Apart from the high surface temperature, one thing that really sticks out to me is the well-mixed boundary layer, which is the layer of the troposphere closest to the surface. In the image above, it’s the layer from the surface to just over 850mb, marked by the relative straight temperature (red) and dew point (green) profiles. In this layer, the temperature is mixed adiabatically, which basically means that the temperature changes at a constant rate with respect to the atmospheric pressure – so, adiabatically, the temperature decreases roughly 10 C for every kilometer above the surface.
Moreover, the moisture is relatively uniform throughout this layer, as well. While this isn’t necessarily true right at the surface, as shown by the little “feet” on both the red and green lines above that don’t follow this straight line, these are due to superadiabatic processes that are a bit too complex to get into for a simple forecast discussion.
What I’m really interested in, though, are the temperatures at the 925mb and 850mb pressure levels, about 2,600ft and 5,000ft above the ground, respectively. According to the data from this launch, the 925mb temperature is 27 C, and the 850mb temperature is 20 C. If we compare this data to what the global models, the GFS and the ECMWF, had at around the same time, we can see how well (or how poorly) they are handling this air mass.


As we can see, both models are only off at most by 1 degree Celsius, so these observations have been generally on track with the model output 850mb and 925mb temperatures, so we can assume that the 850mb and 925mb forecast temperatures for tomorrow should be generally on track as well. This is both good news and bad news; it’s good news because it makes the forecast much more reliable, but it’s bad news because the forecast 850mb and 925mb temperatures are higher for today than they were yesterday.


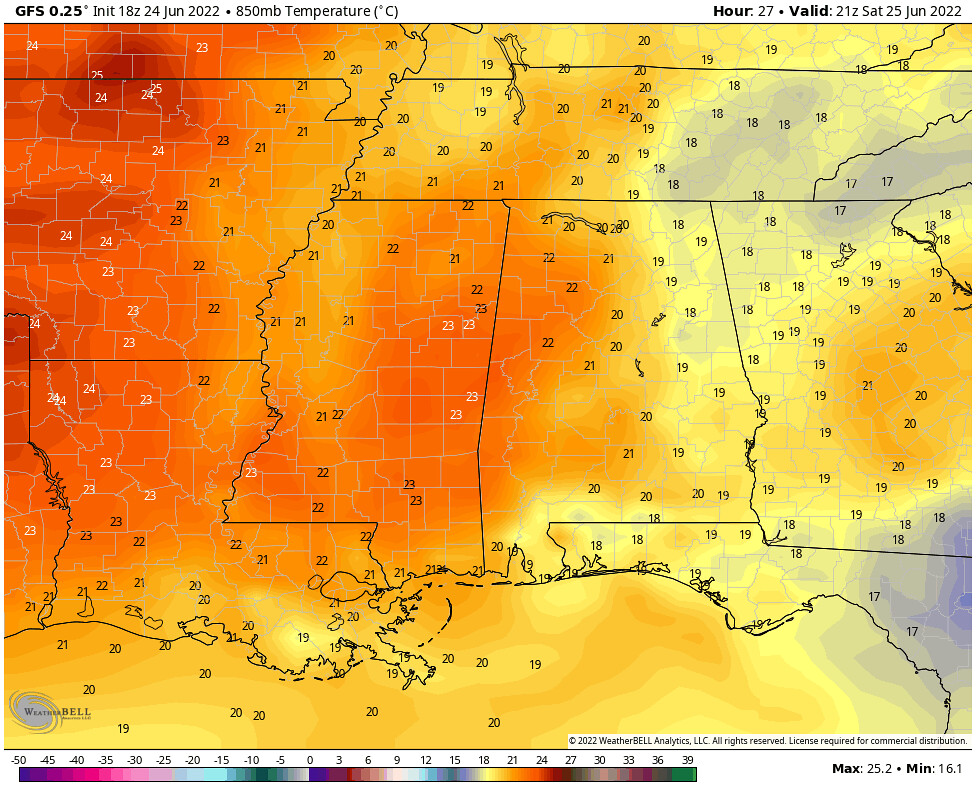

In the top row are the American (GFS) model outputs for both yesterday and today’s 850mb temperatures at 4 PM, and on the bottom row are the European (ECMWF) model outputs for the same times. As is evident in both models, today’s 850mb temperatures will be a few degrees warmer than yesterdays. Keep in mind, however, that we’re talking about degrees Celsius, where one degree Celsius is equivalent to 1.8 degrees Fahrenheit.


Let’s take a look at the temperatures a little bit closer to the surface, once again the GFS 925mb temperature outputs for yesterday and today are in the top row, and the ECMWF outputs are in the bottom row. The same pattern is evident in these figures as well, where today’s temperature are forecasted to be warmer than yesterday’s.
Now, you may be asking, “Okay, Jake, big whoop. Why do I care what the temperature will be thousands of feet above me? I wanna know what it’ll be at the surface!” – Good question! In my experience, models are much more accurate when forecasting the temperatures a few thousand feet above the ground, rather than the actual surface temperature.
This is because there are many more complex processes near the surface that models tend to struggle with, in particular, the superadiabatic processes that I touched on earlier in the article. So if we focus on where the models strengths are – with the 850mb and 925mb temperatures, and assume a well-mixed boundary layer where the temperature cools adiabatically with height, we can get a pretty good idea of what the temperature at the surface will be, give or take a few degrees.
Divulging from my rant on why I don’t always trust model output surface temperatures, it is worth noting the markedly cooler temperatures that both the GFS and ECMWF are showing for portions of eastern Alabama. That’s as a result of some rain cooled air working into the region from an area of showers and thunderstorms expected to develop near the Alabama-Georgia border; a perfect segue to our next topic: our chances for rain.
As shown in the image above, a region of enhanced 500mb vorticity associated with a region of cloudiness in Iowa and Illinois (at the time of writing) will ride around the eastern periphery of the upper-level ridge into Georgia by the afternoon. Vorticity is a great tool to look at when forecasting precipitation because, according every meteorology student’s favorite equation, the quasi-geostrophic omega equation (funny name, serious equation) shown below, a region of vorticity moving into an area results in rising air, which may ultimately lead to precipitation.

While this relatively weak region of vorticity advection isn’t necessarily enough to produce any showers or thunderstorms by itself, combined with the unstable atmosphere due to the high heat and moisture further east, a region of thunderstorms will likely develop in southern and central Alabama and near the coast.

By tonight, the enhanced 500mb vorticity will have exited the region over the Gulf of Mexico, and will continue to move along the southern periphery of the upper-level high westward along the coast of Louisiana by Sunday afternoon. At the same time, the upper-level low that I noted earlier in the article currently moving from the Northern Rockies eastward into the Great Plains will start to squish the ridge that’s been plopped over us for weeks. By this time, the upper-level low will have moved into central Ontario, forcing the ridge of high pressure westward toward the Southwest.

But, good things never come easy and this ridge won’t leave without a fight. A developing surface low pressure system will arise from the region of troughiness in the Great Plains we discussed earlier, moving northeast into Ontario, ahead of the position of the upper-level low.
By this afternoon, a cold front will develop, stretching from southern Manitoba southwestward to the Dakotas, pushing through the northern Great Plains and into the upper Mid-West overnight tonight into Sunday morning. The southern extent of this boundary will eventually stall out over across the Ohio River Valley, just far enough south where another region of enhanced synoptic-scale lift will interact with the disturbance in the northern Gulf, resulting in widespread showers and thunderstorms for the region by Sunday afternoon.


There are still some unresolved differences between some of the short-range models regarding the timing and the distribution of these storms. Nonetheless, the chance for showers or thunderstorms exists Sunday afternoon through most of the day on Monday as the now-stalled front remains around the region.
As the once-dominating ridge retreats west and weakens, synoptic-scale flow will continue to be northerly, bringing a much needed relief to the heat with around average temperatures. By sometime late Tuesday, the upper-level northerly flow will weaken and will be forced out of the south again by a developing ridge off the Southeast Coast of the United States, resulting in enhanced moisture return from the Gulf.

As the ridge continues to build over the region yet again by the middle of the week, a ribbon of enhanced vorticity associated with the stationary front will lead to increased clouds and chances for rain and thunderstorms throughout the week, helping to keep the temperatures a bit cooler.
Day-to-Day Forecast
Saturday
Mostly clear skies with a 30-percent of an afternoon storm. Highs around 100F, with heat index values around 10 F possible.
Sunday
Partly cloudy skies with a 60-percent chance of an afternoon shower or thunderstorm. Expect highs in the low-to-mid 90s.
Monday
Mostly cloudy with a 70-percent chance of an afternoon shower or thunderstorm. Expect highs in the low 90s.
Tuesday
Mostly cloudy with a 70-percent chance of showers and thunderstorms. Expect highs in the upper 80s to low 90s.
Wednesday
Mostly cloudy with a 60-percent chance of showers and thunderstorms. Expect highs in the upper 80s to low 90s.
Thursday
Mostly cloudy with a 60-percent chance of showers and thunderstorms. Expect highs in the upper 80s.
Friday
Partly cloudy with a 50-percent chance showers and thunderstorms. Expect highs in the upper 80s to low 90s.


Great weather news! We need rain!