Our first Atlantic Tropical Storm, Arthur, is currently tracking northeast along the Texas/Louisiana coastline with maximum sustained winds near 45 mph. The system is expected to remain relatively weak but will continue to bring a significant threat of heavy rainfall and flash flooding across portions of the South through the week.
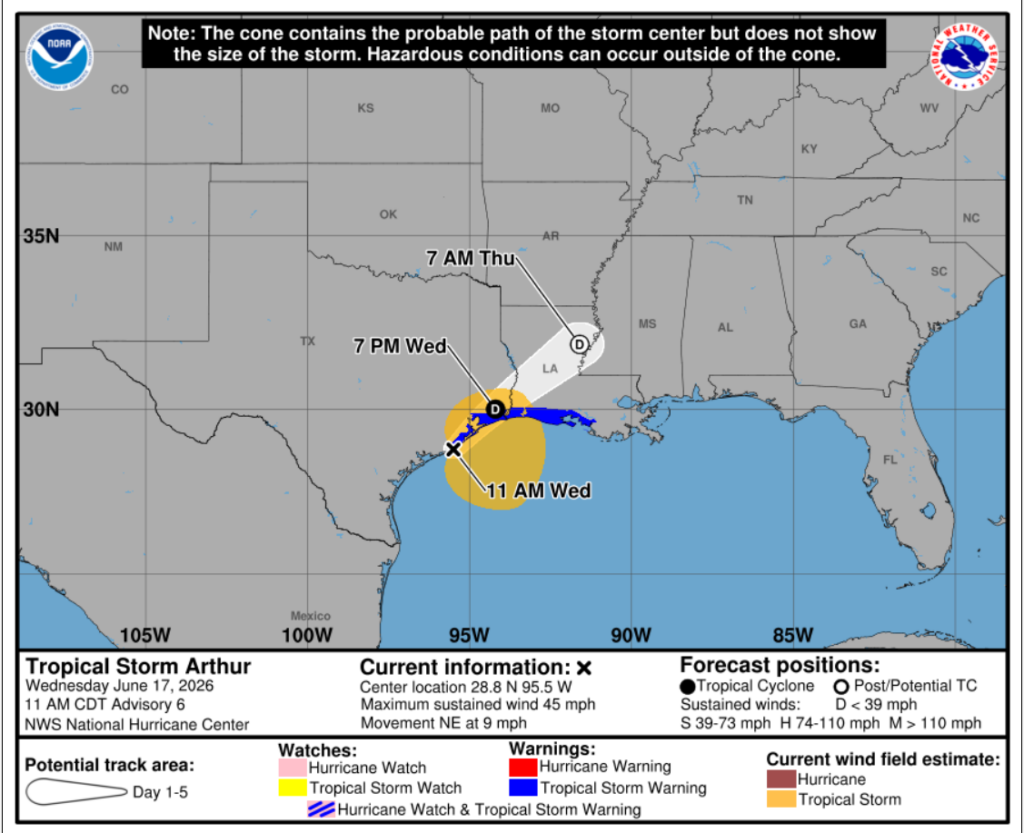
The current “track” for Tropical Storm Arthur shows that landfall is expected around 2:30 PM this afternoon near Matagorda Bay, Texas. Shortly after landfall, the storm will weaken to winds of less than 39 mph, which will hopefully downgrade it into a tropical depression. Even though this storm is expected to weaken upon landfall, the threat of excessive rainfall leading to flooding is still dangerously high across Texas, Louisiana and even into Mississippi, Alabama and Florida as this storm advances Northeast.
It’s easy to tell that the bulk of this storm is concentrated on the East side, fortunately sparing South Texas and Louisiana from much of the nastiness associated with the “dirty side” of tropical cyclones. With this being said, we are seeing that the lopsided part of this storm will be moving inland as this storm progresses, impacting states that are out of the “cone”. This is a good time to emphasize that even though your city may not be in the “direct path” of this storm, the entirety of the South will feel its impacts.
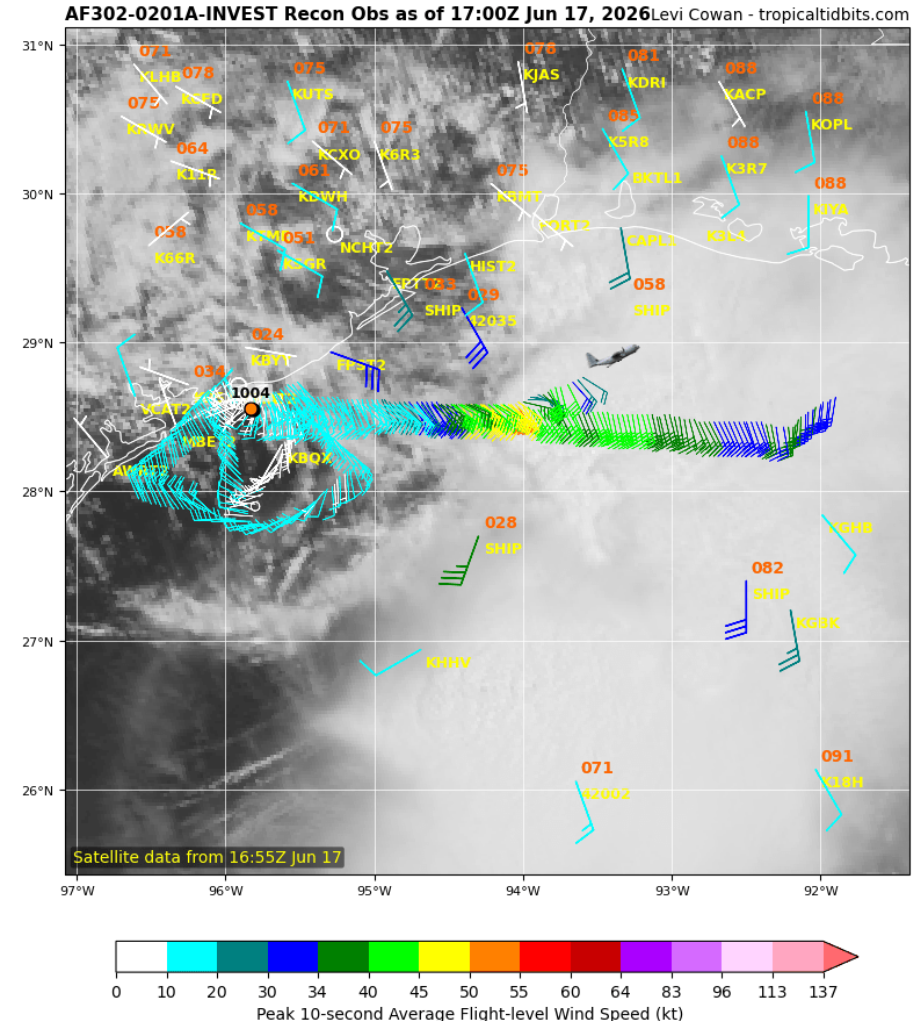
This map above shows data from a Hurricane Hunter aircraft that flew into Tropical Storm Arthur today. To simplify this map, the wind barbs (pokey things that look like forks), demonstrate the path of the aircraft moving into the storm from East to West, and display the wind direction and speed in knots; these barbs are also color-coded for convenience. We can tell that as this aircraft flew in, it encountered the strongest wind speeds in the yellow/orange section directly south of Port Arthur (ironically).
The yellow highlighted numbers and letters seen on the map are weather stations located on land, oil rigs, or buoys, with the orange numbers above them showing sea-level pressure (ex- 071 means 1007.1 mb). Now for the main attraction, the big ole orange dot labeled 1004. This is the estimated center of our storm marking the approximate center of minimum central pressure (1004 millibars). In meteorology, the lower this pressure drops, the stronger the storm is becoming. The fact that the wind barbs are tightly circling this exact spot confirms that a closed circulation is trying to form.


