Introduction
You’ve probably heard of the term “flash flood” before, after all, it is one of the most common weather events in the deep south, especially in the spring and summer. Something that fewer people have heard of is the term “flash drought”, which is the exact opposite of a flash flood, and can be just as impactful as one. The National Integrated Drought Information System, a multi-agency NOAA program, defines a flash drought as simply “the rapid onset or intensification of drought”. They are caused by much below normal precipitation in conjunction with unusually high temperatures, winds, and solar radiation.
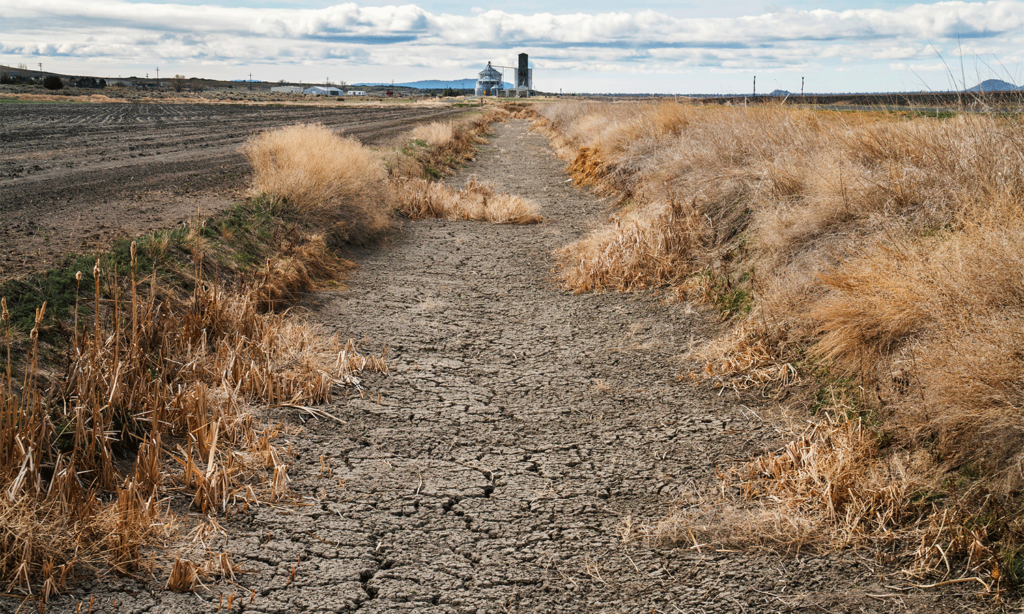
In the fall of 2019, many cities across the southeastern United States experienced a flash drought, causing brush fires, some water shortages, and agricultural disruptions. While the impacts of the 2019 flash drought were not very severe, in this research article I intend to delve deeper into the meteorological causes of the drought as well as whether or not events like this will become commonplace in the future.
Atmospheric Conditions That Led to the Flash Drought
Before I get into the mid-level ridge/trough pattern that led to the flash drought, there are three fundamental meteorological concepts that are necessary to understand: cold air is denser than warm air, dry air is denser than moist air, and air flows from high pressure to low pressure. In an area of high pressure, the air dries and sinks. As the air sinks, it warms, and since warm air has a greater capability to hold moisture than cold air, the relative humidity of that air decreases, making it even more dense. This means that areas of high pressure are usually associated with sunny, warm, and dry weather conditions as well as sinking motion. In an area of low pressure, the air, which converges at the surface, has nowhere to go but upwards, so it rises. This typically leads to convection and is associated with precipitation.
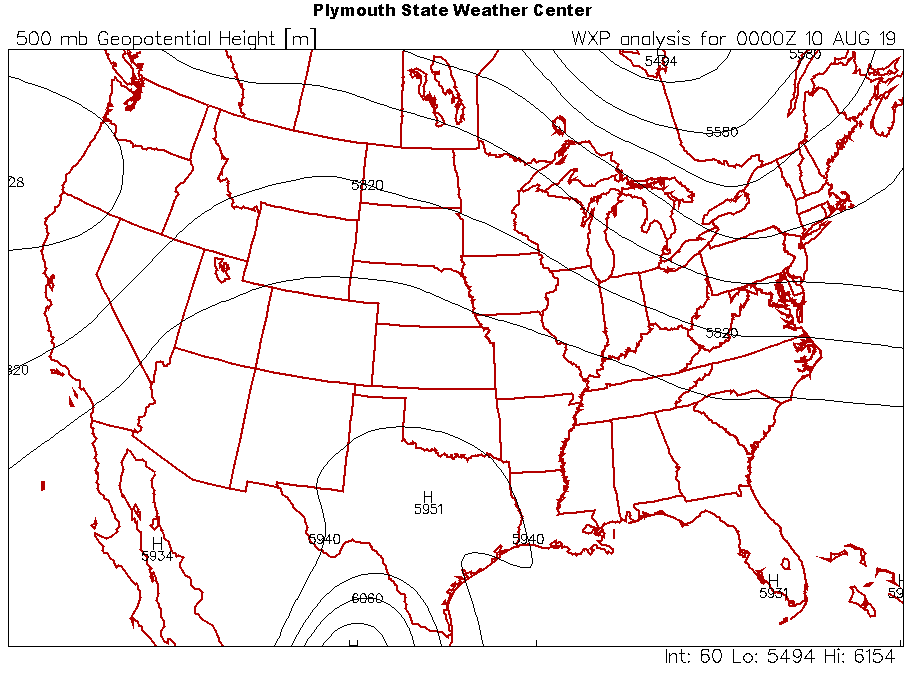
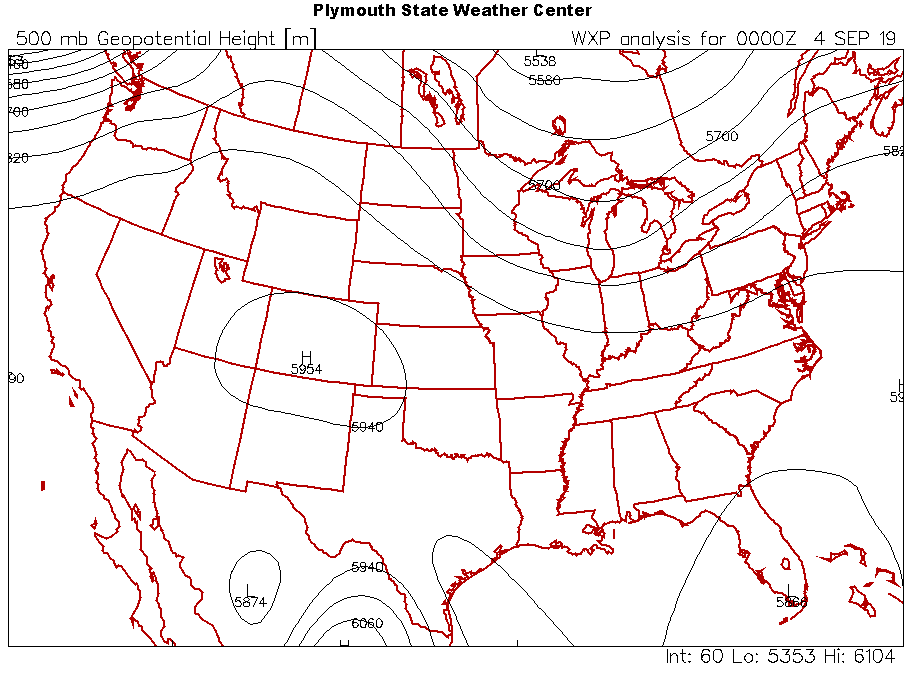
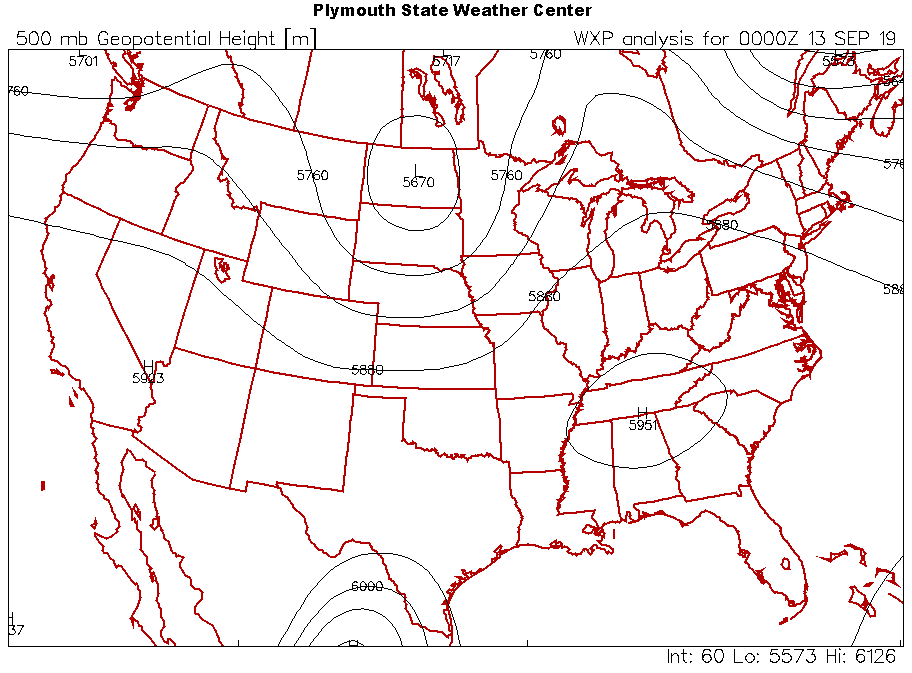
In August of 2019, the dominant weather pattern over the lower 48 was a ridge of high pressure centered over the southwestern United States and southern plains. This was a classic summertime weather pattern that typically delivers heat to those regions. As a result, much of that area saw one of the hottest August’s on record. Meanwhile, the southeast, where a flash drought would develop the next month, saw temperatures that were only slightly above normal, and precipitation that was near to slightly above average, a far cry from flash drought conditions. In early September, the ridge that was over the southwest shifted further to the east, generally centering itself over the southeast. This hot and dry air mass brought temperatures that were above average and precipitation that was close to average for the southwest in August, but brought record hot and record dry conditions for the southeast in September.
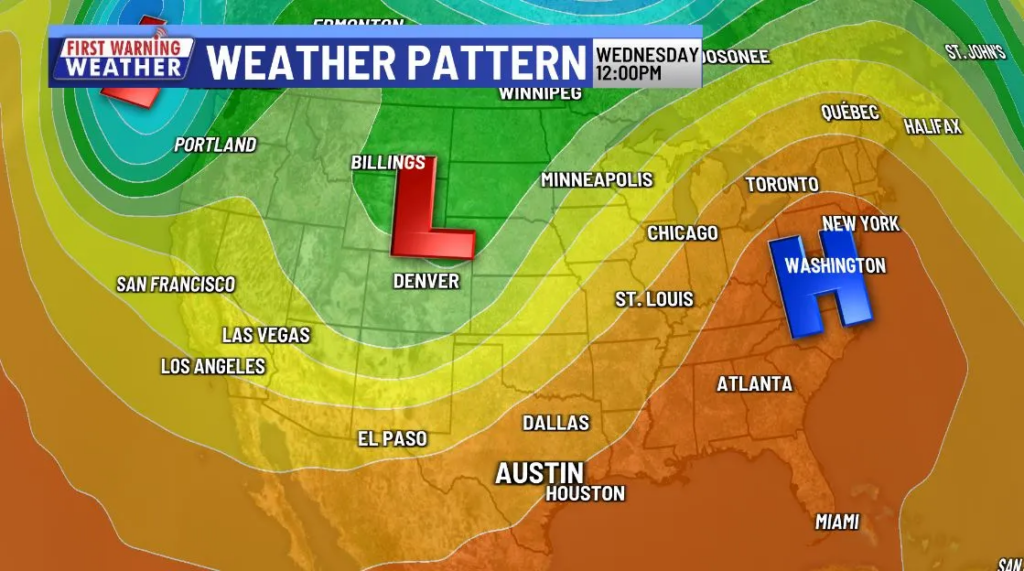
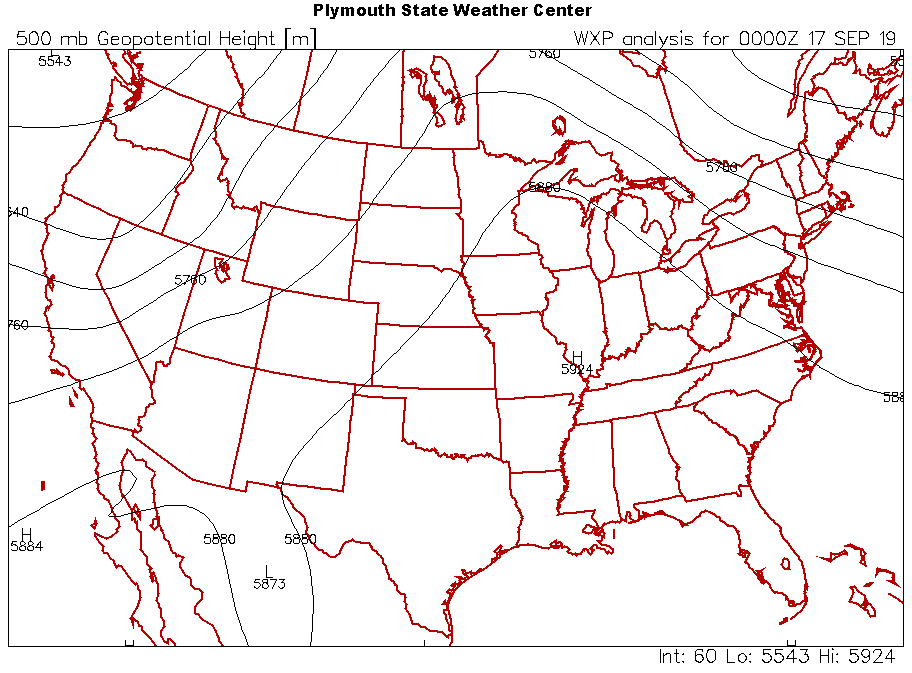
Throughout that month and for the first week of October, a consistent and strong ridge of high pressure kept itself anchored over the southeastern United States, while a trough of low pressure persisted over the northern plains, rocky mountains, and upper midwest. The dominant weather pattern that month looked quite like the above image. This weather pattern was the single biggest factor that led to the development of the flash drought, a stark contrast to the cool and record wet conditions the northern plains experienced in September.
September 1-8
The first week of September looked similar to August, with a ridge over the southwest, and a trough in the northeast and upper midwest. In the southeast, temperatures were above normal and very little precipitation fell. While the ridge of high pressure was not directly over the southeast, the air in the mid-levels was being recirculated from the ridge, so that air was very dry. This prevented significant thunderstorm development because rising air at the surface ran into air that evaporates moisture, causing convection to significantly slow or cease entirely.
September 10-14
After the first week and a half of September saw weather conditions similar to that of August, the period from September 10-14 saw some serious heat. This was due to a powerful ridge which centered itself over Tennessee, bringing record breaking temperatures and little to no precipitation.
Part of the reason why this air mass was so hot has to do with the circulation of air. Winds flow clockwise around an area of high pressure in the northern hemisphere, so the air that was at the surface and in the mid-levels in the southeast was re-circulated air from places southwest of us, such as Texas and Mexico. This means the air in our region during this time period was very hot and bone-dry, unlike the usual hot and humid air from the Gulf of Mexico we’re used to. Since it takes more thermal energy to raise the temperature of moist air than that of dry air, the high temperatures in the southeast could keep on rising, hitting record highs.
Many record highs were broken on September 13th, which was the hottest day of the month for many cities across the southeast. Birmingham saw a high temperature of 99ºF that day, one of the hottest temperatures ever observed in the month of September, 12ºF above the average. In some places, it was the hottest day of the year, a title usually reserved for a day in July or August.
September 14-21
In mid-September, the ridge that was over Tennessee shifted slightly to the northwest, allowing for temperatures to cool down slightly. Still, temperatures were hot, and this weather pattern allowed for no significant rainfall in the southeast. Rainfall in the warm season usually occurs in two ways: when two air masses collide, allowing drier/denser air to sink causing moister/less dense air to rise, or via pop up thunderstorms. The southeast was nowhere near the boundary between a ridge and a trough, and the high pressure situated over the area prevented thunderstorms from deepening enough to produce significant rainfall.
At this point, it had been more than two weeks since the southeast saw any significant rainfall. Lawns were starting to brown, rivers and streams were flowing at below normal levels, and abnormal dryness/moderate drought began to show up on the drought monitor.
It’s important to note that it had been nearly 3 weeks since any rain fell over the southeast. This is because droughts and heatwaves amplify each other. When you’re in a flash drought, the soil obviously gets very dry. This causes the air temperature to rise because less solar energy goes into evaporating the water within the soil, therefore more solar energy can go into heating the air above it. Then, the soil gets even drier and the cycle continues. Drought also leads to even more drought since fewer rain clouds can form over drought stricken land as there is no water to evaporate.
September 22-October 5
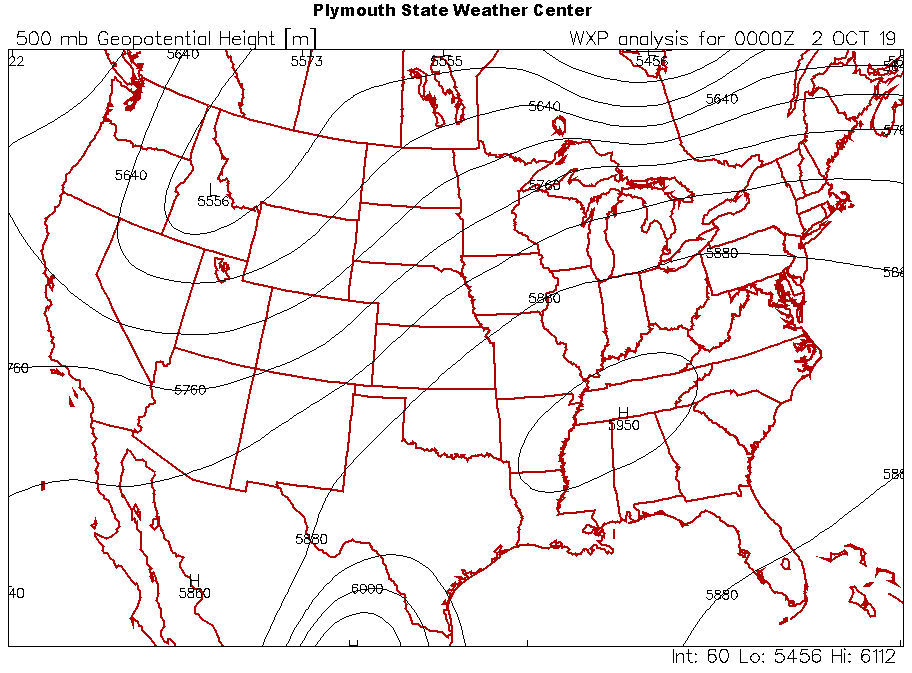
Out of the month and a week that the flash drought developed, the period from September 22-October 5 saw the most anomalously warm temperatures. Similar to the hot spell in early-mid September, this one was again caused by a potent ridge of high pressure that was situated directly over Tennessee. The only difference was that this time, the ridge extended further north, allowing some parts of the northeast to get in on the heat.
To give you an idea at how anomalous this heat was, every day from September 26-October 5 in Birmingham saw a record high temperature in the upper 90s or over 100. That’s 10 consecutive days of record heat! It even got to 101ºF in Birmingham on October 3rd, hotter than any day in September, and the hottest October temperature ever recorded. In nearby Mobile, there were 7 days of record highs from September 26-October 5.
Recap and Impacts
As you might be able to guess, September of 2019 went down as among the hottest and driest in recorded history in many locations across the southeast. In Birmingham, every day of the month but two had a high temperature in the 90s, and those two days had highs of 88ºF and 89ºF respectively. Six days saw record highs. Precipitation for the month was paltry, amounted to a bit more than half of an inch, with measurable rainfall occurring on only two days. In nearby Montgomery, the average high temperature was 97ºF, which would be hot for July and August! Additionally, a meager 0.05” of rain fell, and it was all on the first day of the month! Montgomery wouldn’t see any measurable precipitation for another 34 days.
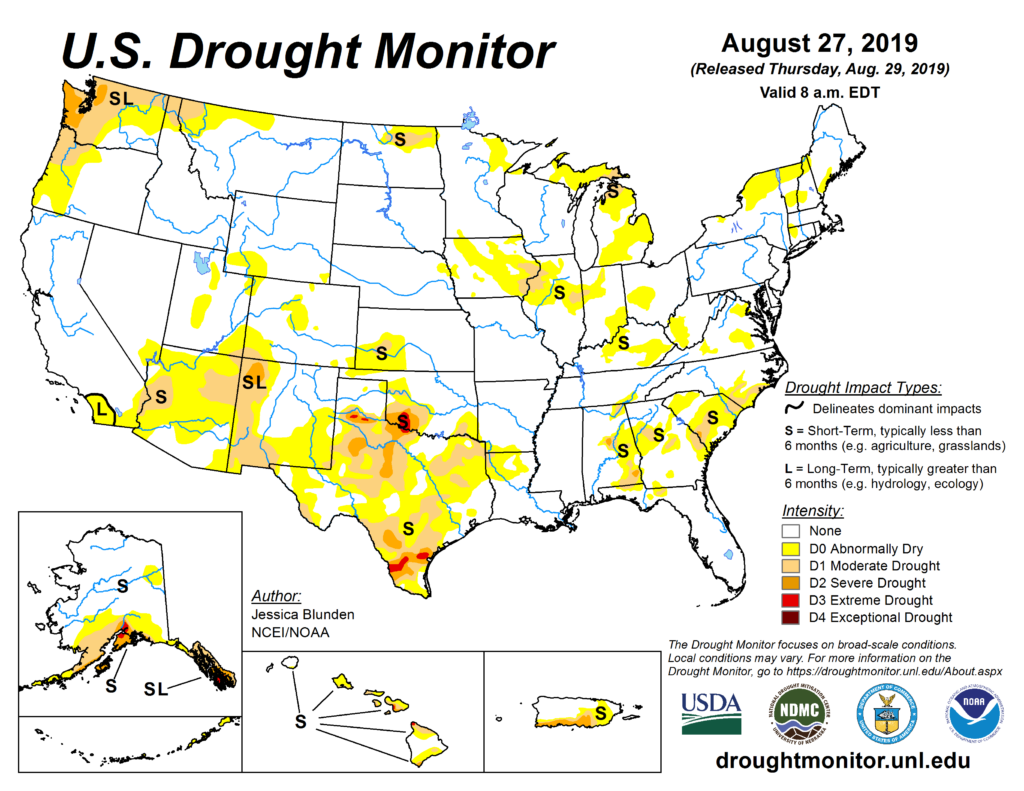
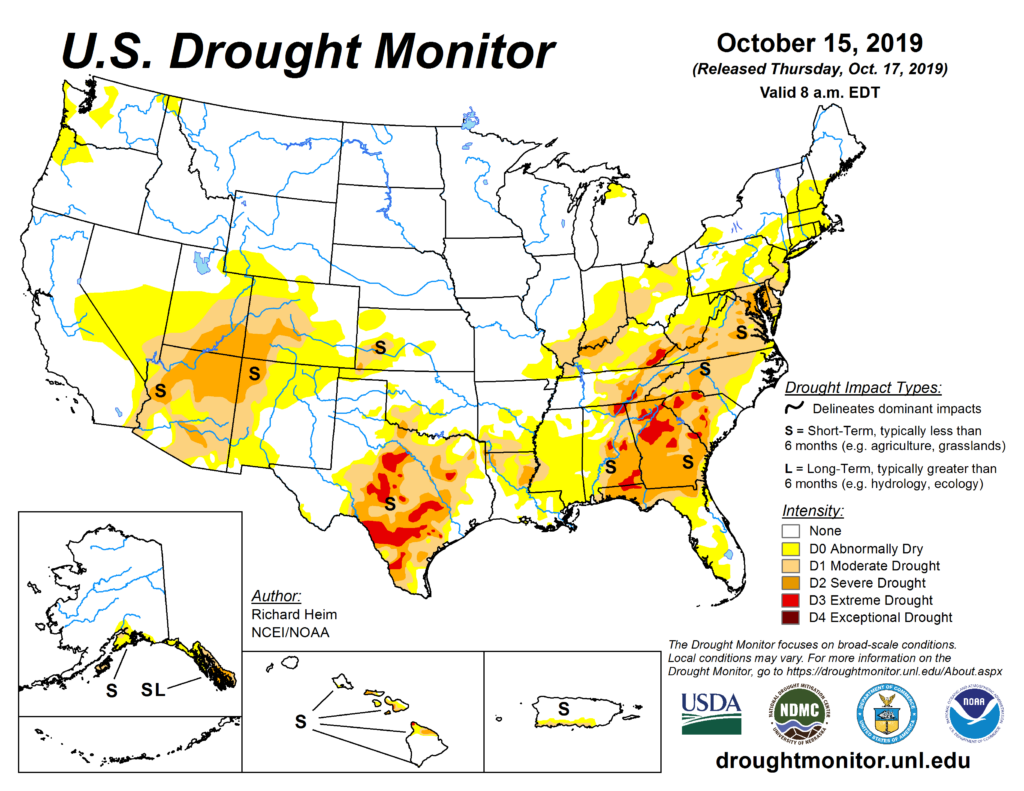
At the end of August, there were some areas of abnormal dryness (D0) and moderate drought (D1), but drought was not widespread by any means. If you skip ahead just 7 weeks to mid-October, the southeast was covered with a large area of severe drought (D2), and even some areas of extreme drought (D3).
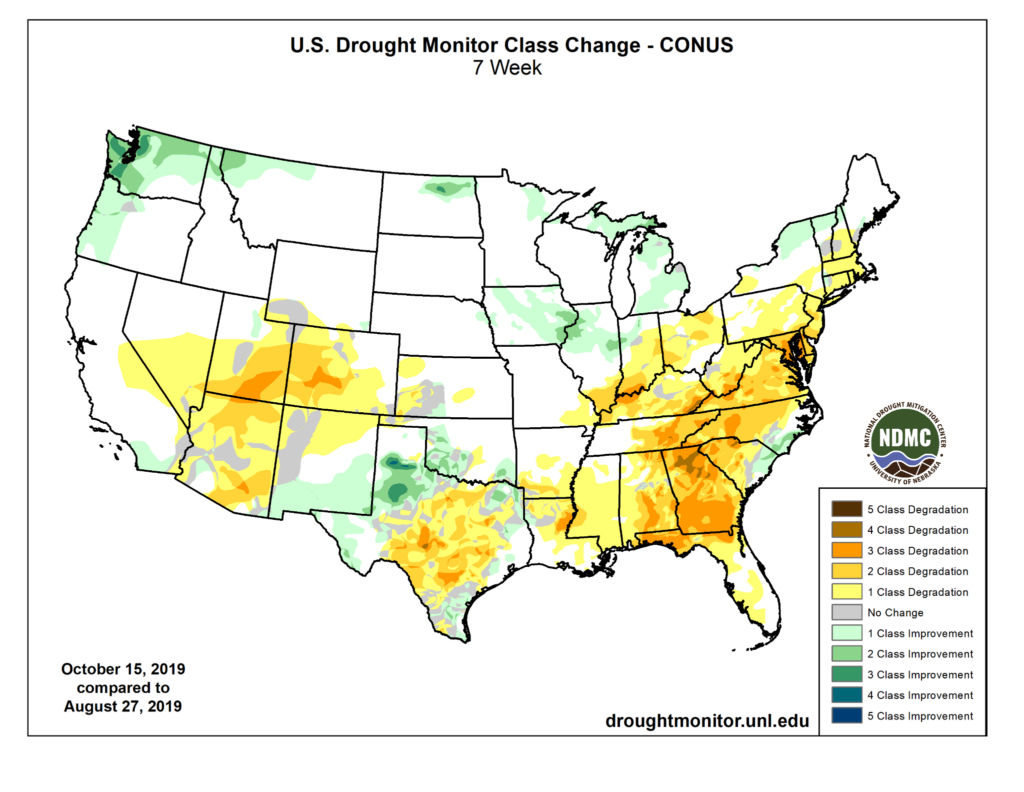
In that 7 week period, many parts of the southeast saw a 2-3 class degradation, and some parts of northern Georgia saw a 4 class degradation! That would be like going from having no drought, not even abnormally dry conditions, to extreme drought (D3) in just 7 weeks! In most instances, it would take several months for such a feat to be accomplished.
Thankfully, this flash drought was not as impactful as other more long-term droughts have been in the past. Impacts were limited to low stream flows preventing reservoirs from recharging fully, crops struggling to reach maturity, and poor pasture conditions.
Rain Returns
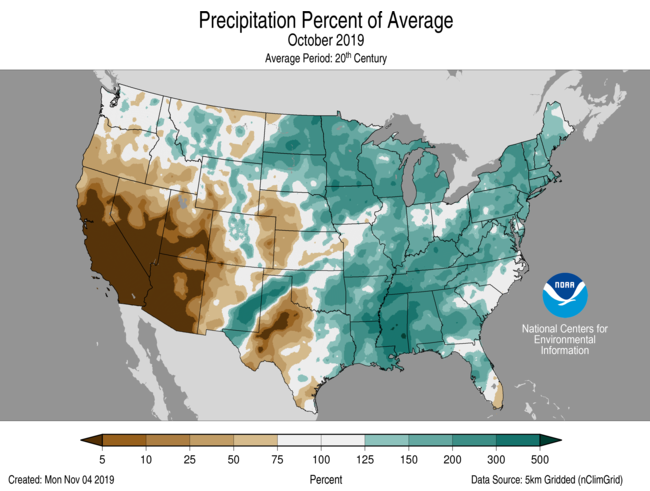
In the second half of October and November, the flash drought left almost as quickly as it developed. October 2019 saw precipitation that was much above normal for much of the southeast, with Mississippi experiencing its wettest October on record, one month after experiencing its driest September on record. This was in part due to two tropical systems which dropped heavy rain on our area, tropical storms Nestor and Olga.
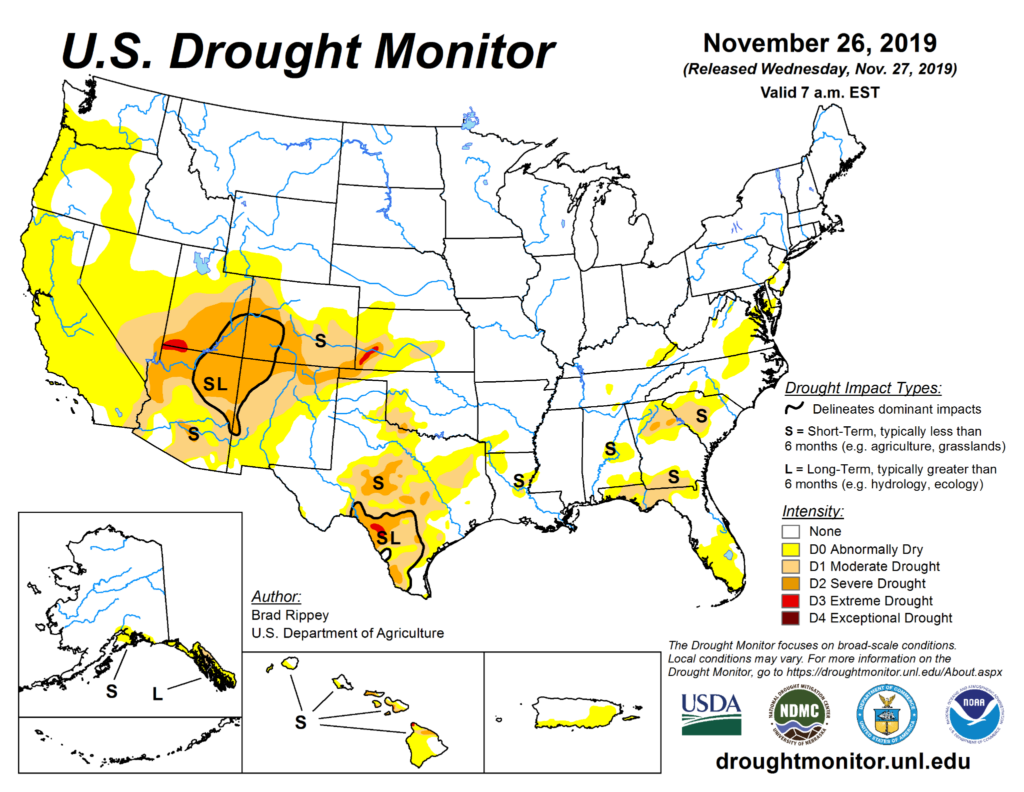
The rain in October and November proved to be hugely beneficial. By the end of November, the drought monitor in the southeast looked similar to how it did at the end of August.
Future Trends and Broader Causes
One parameter to look at when trying to understand if extreme ridges over the southeastern United States will become more common in the future is the Indian Ocean Dipole (IOD). The IOD is an oscillation of sea surface temperatures in the tropical Indian ocean. A positive IOD phase features warmer than normal sea surface temperatures in the western Indian ocean. This causes the air over the unusually warm ocean to heat and rise. This air spreads out aloft, then sinks over the eastern Indian ocean, causing cooler and drier conditions to the east.
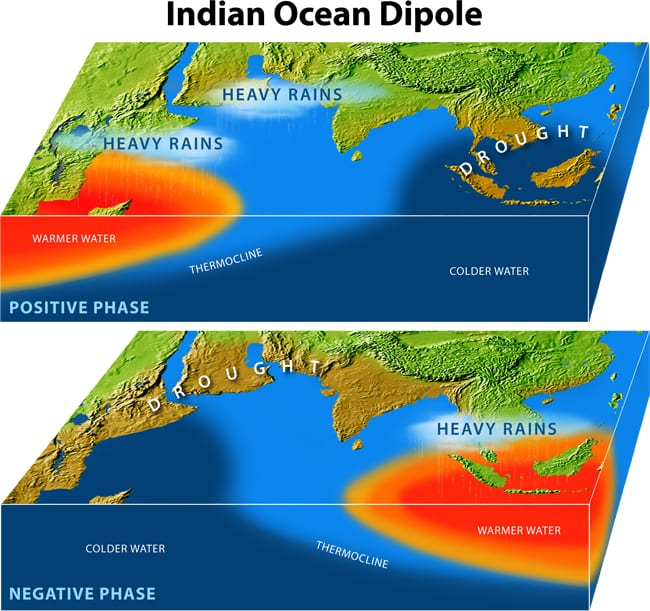
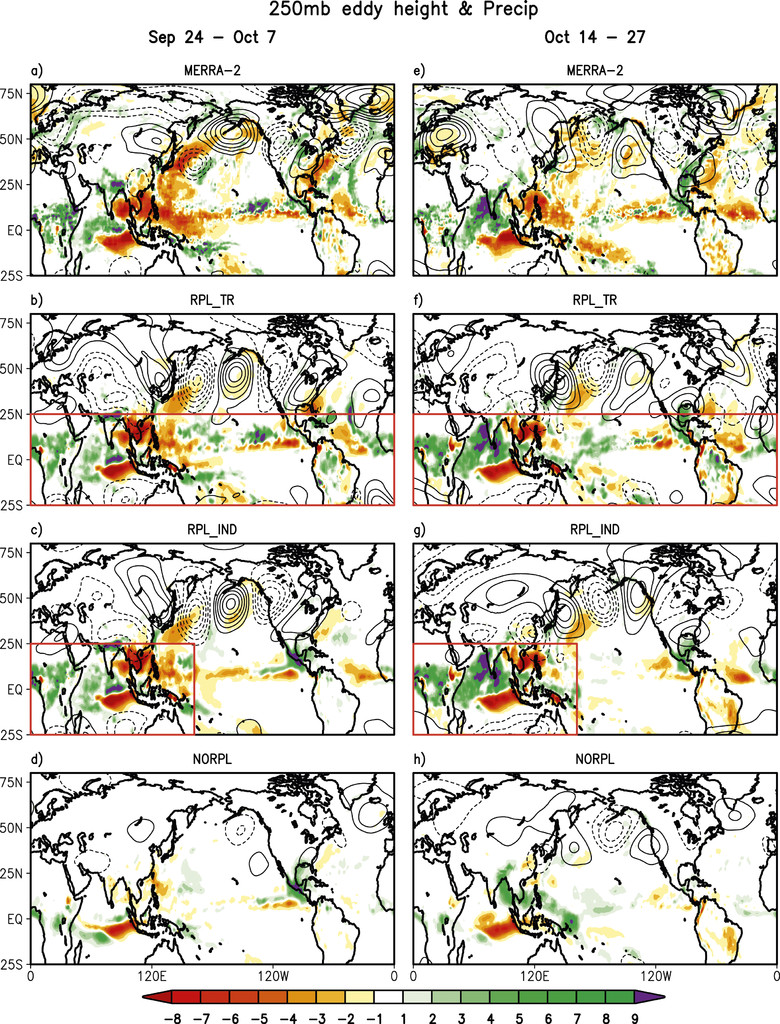
In the fall of 2019, the IOD was in an extreme positive phase. This led to a ridge-trough-ridge-trough pattern across the northern Pacific and North America that caused the powerful ridge to hover over the southeastern United States for all of September and the first week of October.
The ridge-trough-ridge-trough pattern (left) looked like this:
There is evidence that climate change is causing the western Indian ocean to warm faster than the eastern Indian ocean, meaning that the positive phase of the IOD is becoming more common over time. This would mean that freak events like the Fall 2019 flash drought are likely to become more common as climate change worsens.
Final Thoughts
Since the fall 2019 drought, there have been other notable flash droughts in the United States, namely one that impacted the entire eastern United States in October of 2024. The impacts of that flash drought were similar to the impacts of the fall 2019 event. Neither of these events caused major disruptions, as they both ended relatively quickly, preventing major water shortages from ensuing. It’s also important to remember that these two events are uncommon, and I certainly wouldn’t say that extreme flash droughts will become “commonplace” in the future. However, it’s still vital that we take the necessary precautions now and in the immediate future in case we experience something similar, but to an even more extreme degree. As climate change worsens and more people live through similar flash droughts, I hope that interest in research about this topic grows, and potential forecasting advancements are made.
Sources
Arndt, Deke. “Steam Baths and Ovens: Soil Moisture in the Summer | NOAA Climate.Gov.” NOAA Climate, 2 June 2016, www.climate.gov/news-features/blogs/beyond-data/steam-baths-and-ovens-soil-moisture-summer.
Davis, Corey. “A Hot, Dry September Sees Drought’s Rapid Return – North Carolina State Climate Office.” North Carolina State Climate Office, 3 Oct. 2019, climate.ncsu.edu/blog/2019/10/a-hot-dry-september-sees-droughts-rapid-return/.
Di Liberto, Tom. Flash Drought Engulfs the U.S. Southeast in September 2019 | NOAA Climate.Gov, 9 Oct. 2019, www.climate.gov/news-features/event-tracker/flash-drought-engulfs-us-southeast-september-2019.
Fereday, David R, et al. “Climate Change Alters the Indian Ocean Dipole and Weakens Its North Atlantic Teleconnection | Communications Earth & Environment.”, 26 Feb. 2025, www.nature.com/articles/s43247-025-02131-5.
“Flash Drought | Drought.Gov.” National Integrated Drought Information System, www.drought.gov/what-is-drought/flash-drought. Accessed 19 June 2026.
Schubert, Siegfried D, et al. “On the Development and Demise of the Fall 2019 Southeast U.S. Flash Drought: Links to an Extreme Positive IOD in: Journal of Climate Volume 34 Issue 5 (2021).” American Meteorological Society, 2 Feb. 2021, journals.ametsoc.org/view/journals/clim/34/5/JCLI-D-20-0428.1.xml.
Tong, Bo, et al. “Rising Warm Positive Indian Ocean Dipole under Global Warming: Early Western Indian Ocean Warming as a Key Predictor – Sciencedirect.” ScienceDirect, 18 Apr. 2025, www.sciencedirect.com/science/article/abs/pii/S2590332225001034.
Past Weather and Climate Data:


