It really was. In 1969, hurricane forecasting relied heavily on weather satellites that were still relatively new, planes flying into storms, ship reports, hand-drawn maps, and computers less powerful than what’s in a modern microwave. Suddenly, forecasting hurricanes today doesn’t seem so hard!
It was the summer of ’69, the summer of the moon landing, the summer of Woodstock, and… the summer of Hurricane Camille. Early forecasts suggested a turn toward the Florida Panhandle, but Camille maintained an
unwavering course directly towards Mississippi. On August 17, a hurricane warning was issued, and evacuation orders were made about 18 hours before landfall, only about half of the residents in some areas evacuated. The storm made landfall that night as a Category 5 hurricane.
Though small in size for a Category 5 hurricane, Camille produced wind gusts up to 200mph and a 25-foot storm surge that devastated the Mississippi Coast in just 3 hours. Camille represents both the serious limits of hurricane forecasting at the time and the advances in the prediction system made since then.
HOW DID WE KNOW IT WAS COMING?
Satellite
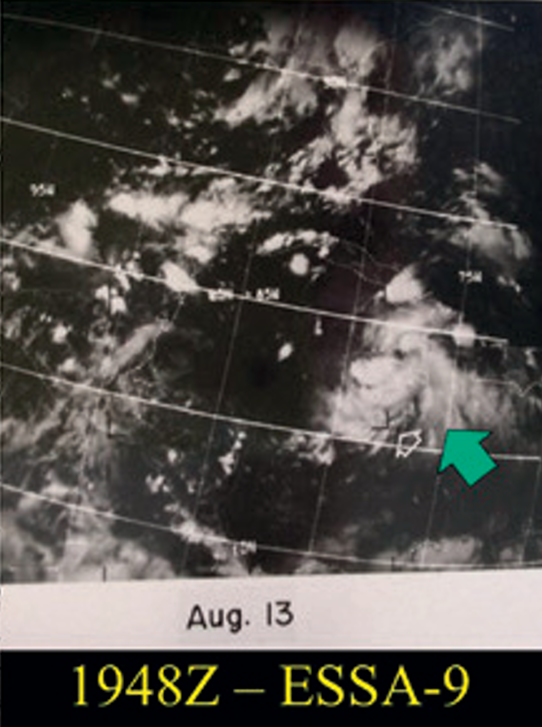
In the 1940s, you typically didn’t know there was a hurricane until either a boat, plane, or coastal city encountered the storm….yikes. About 20 years later, satellite imagery began to emerge, with early systems like ESSA-9 and NIMBUS-3, providing visible images of the atmosphere.
The images showed changes in cloud cover over different regions of the globe, helping forecasters identify and track hurricanes as they neared land. Hurricane Camille started as a tropical wave off the coast of West Africa and was detected August 13th via ESSA-9 imagery, showing the classic banded cloud structure of a developing tropical storm.
Using ESSA-9 and other satellites, forecasters were able to track Camille’s position and intensity up until her landfall.
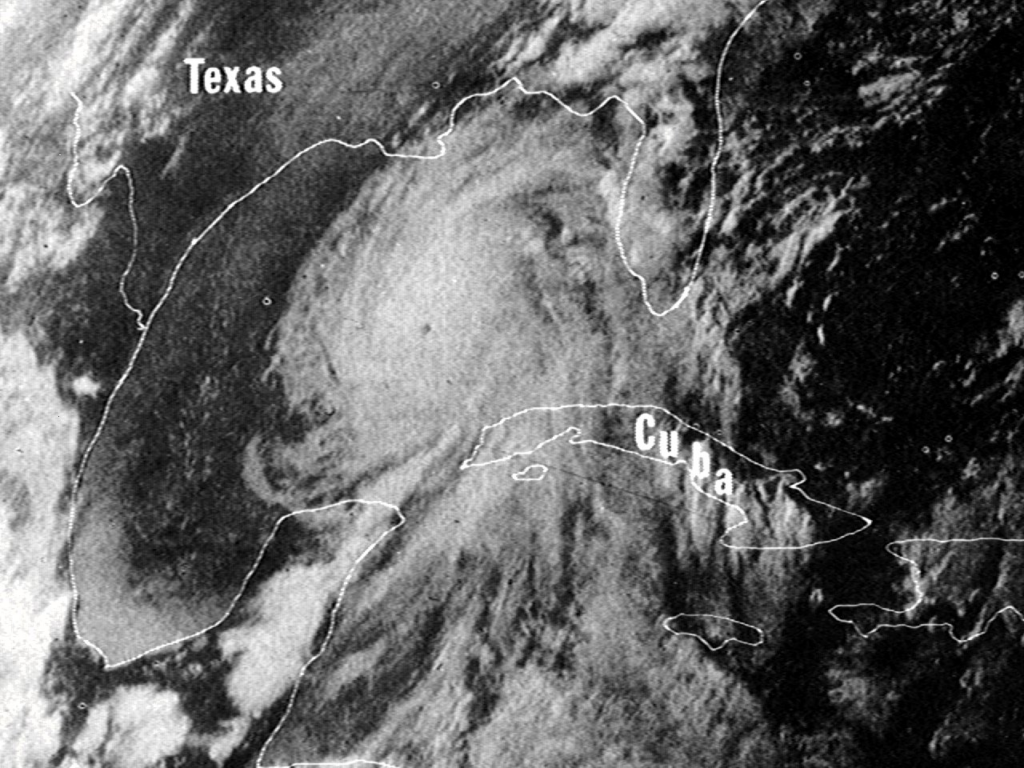
Once entering the Gulf, Camille underwent explosive strengthening. On August 16th, a small eye with a diameter of less than 10 miles was visible, an indicator of an extremely intense hurricane.
Aircraft
While satellites greatly improved the ability of forecasters to detect and track hurricanes, forecasters often disagreed over the interpretations of the imagery coming in from the satellite and what they represented.
Solution?
Fly straight into the storm! The birth of hurricane hunters dates back to 1943, when a pilot bet that he could fly into a Category 1 hurricane off the coast of Galveston, Texas. What began as a bet soon became a routine practice.
Flight crews were tasked with locating the center of hurricanes and provide visual estimates of wind speed.
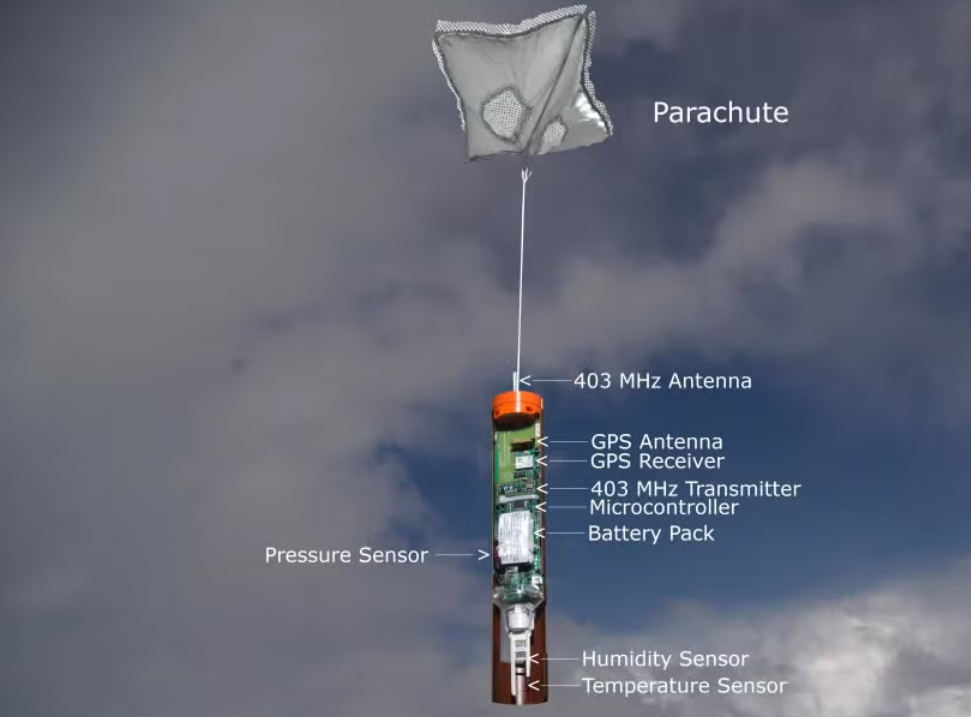
Part of this mission was accomplished using dropsondes. Dropsondes are exactly what they sound like; they’re sondes that you drop. These cylindrical tubes collect valuable data as they fall, including pressure, temperature, humidity, and wind speed. The information is then relayed via radio transmission in real time to the National Hurricane Center.
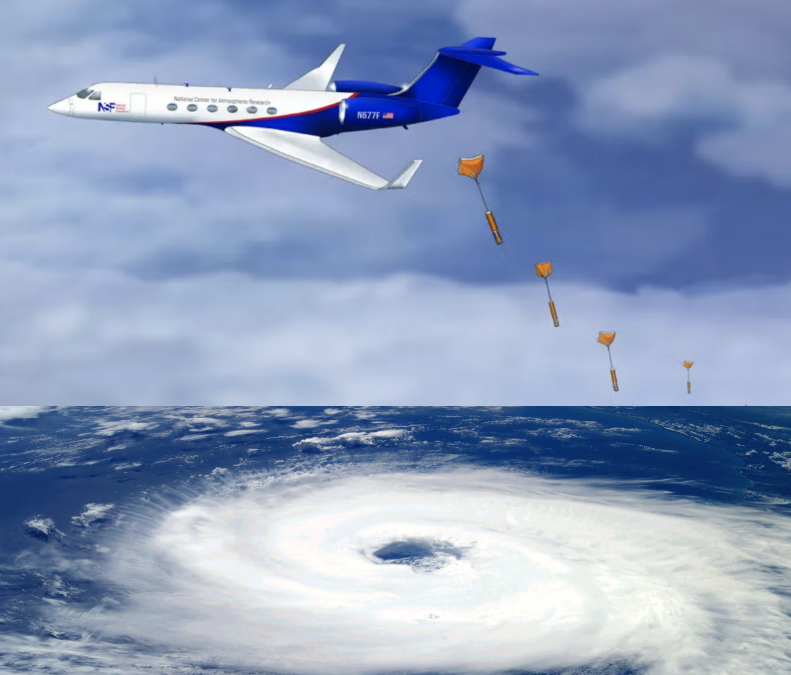
Since Camille’s beginning as a tropical depression, a series of routine flights were sent to monitor her growth. and report back. Once she emerged in the Gulf, flights were sent multiple times a day.
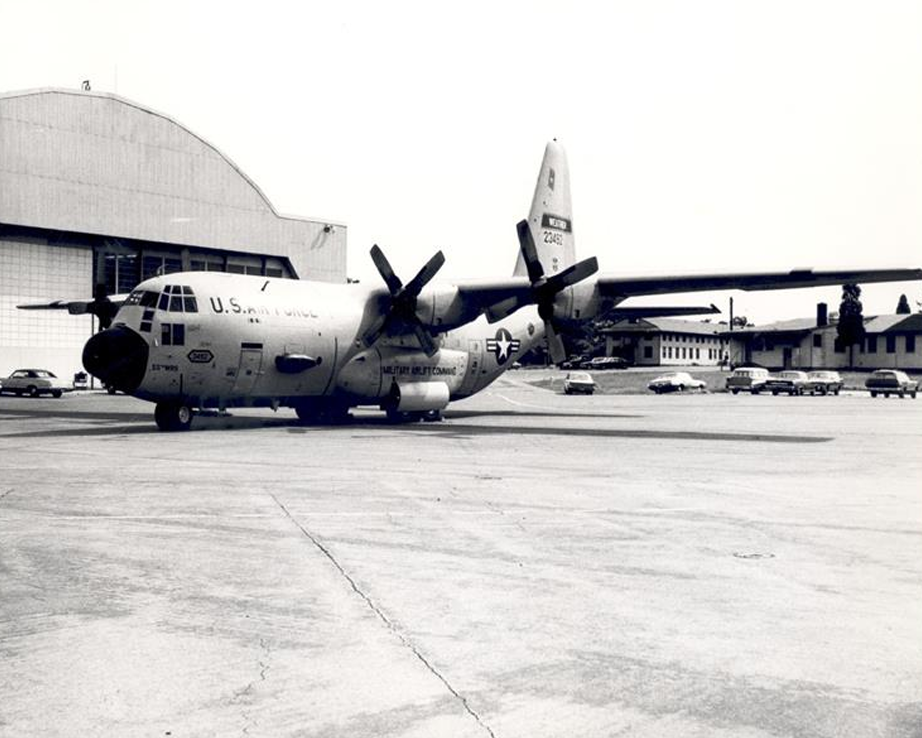
USAF Reconnaissance Flight: Gull 3 / Camille (Hercules for short) was sent to collect data around mid-day on August 17th, as Camille had her eyes locked on the Mississippi coast.
Flight crew reported a clearing in the clouds, despite at some distance from the eye of the hurricane. Turns out this was a double eyewall, a phenomenon that occurs in 50% most intense hurricanes.
Severe turbulence tossed Hercules around resulting in two engine emergencies, in which the pilots decided to immediately abort the mission. They did, however, manage to release a dropsonde that revealed a central eye pressure of 901 mb (later corrected to 905mb) and an average wind speed of 213 mph. Because of flights like this, the intensity of this hurricane was known, and was “estimated to have saved many thousands of lives” -Mariners Weather Log.
Surface Observations
The aforementioned engine failures meant there were no flights during the last hours before landfall. Thankfully observations from the ground were able to partially fill this void of information.
Two pressure readings were taken by Charles Breath on his home marine barometer. The first reading showed a pressure of 909mb just as the roof of his home was ripping off, followed by another reading of 904mb. The barometer was later checked by the New Orleans weather office and found to be accurate.
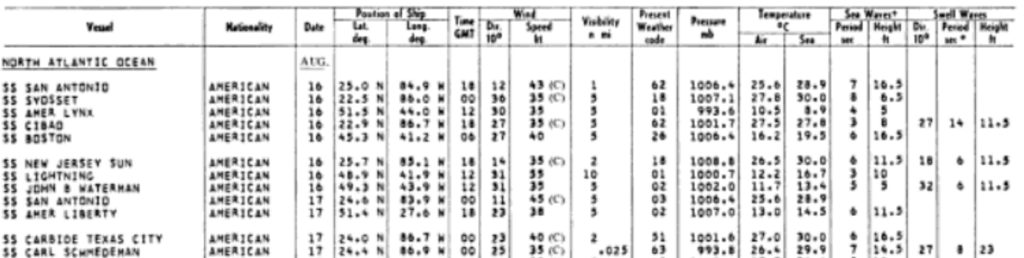
Another valuable contribution to forecasting were observations from ships. The SS Carl Schnedemann, either on purpose or by accident, got very close to Camille as she was intensifying in the Gulf. The 1970 edition of the Mariners Weather Log contains an observation from this vessel reporting a pressure of 993 mb, heavy rain (weather code 63), and visibility less than 0.025 miles. Given these measurements, it seems reasonable to assume the SS Carl Schnedemann was feeling the wrath of Camille’s outer rainbands.
Radar
WSR-57 (WSR: weather surveillance radar, designed in 1957)
At the end of the WWII, the military donated 25 radar systems to the Weather Bureau, which were then reconfigured into the first modern weather radars. A coastal array of WSR-57s had been deployed during the 1960s and were available to monitor Camille as she made landfall. The hurricane’s close proximity to the coast allowed for detailed scanning of clouds. However, these radars did not have the capacity to view wind speed or droplet size, all of which today’s radars can with the introduction of dual-polarized radar in 2003.
Below is a comparison of hurricane radar imagery then (left) vs now (right).
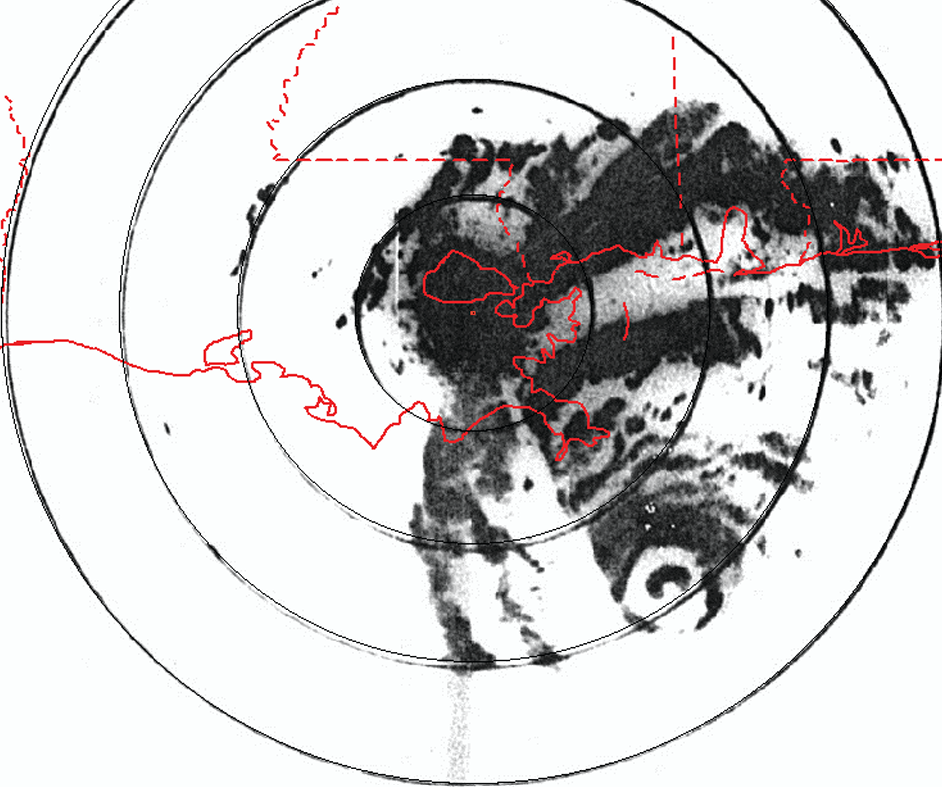
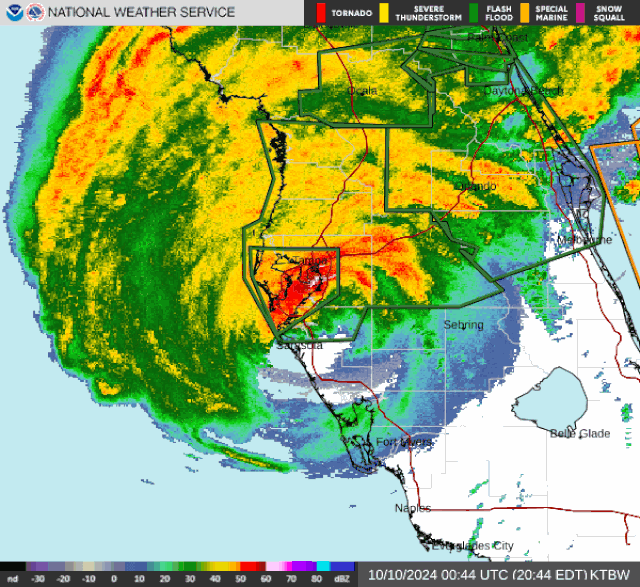
Courtesy: Margaret e. Kieper in 2016 and noaa.gov
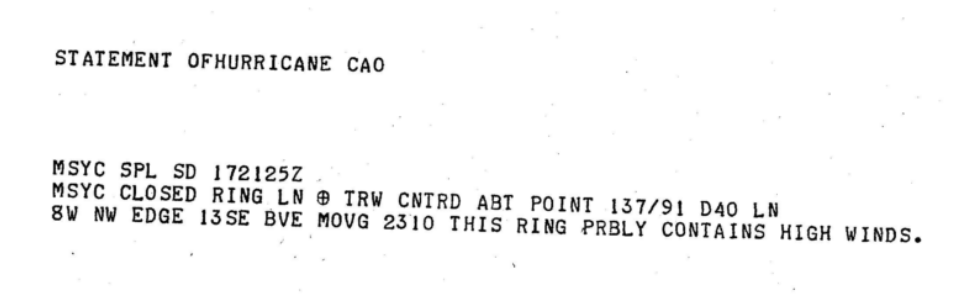
In 1969, radar images could only be viewed in real time and only by the radar operator themselves. The operator was responsible for writing up a text report (subject to the interpretation of the operator) that was then sent via teletypewriter to the National Hurricane Center. Have fun trying to decode the message below!
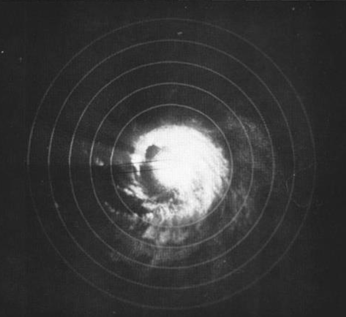
IN-FLIGHT RADAR
Aircraft also carried onboard radar and monitored Camille by either circling the storm or flying directly through it. Shown below is an image captured by the reconnaissance aircraft “Navy 7,” which photographed Camille shortly before it strengthened into a tropical storm.
FORECASTING
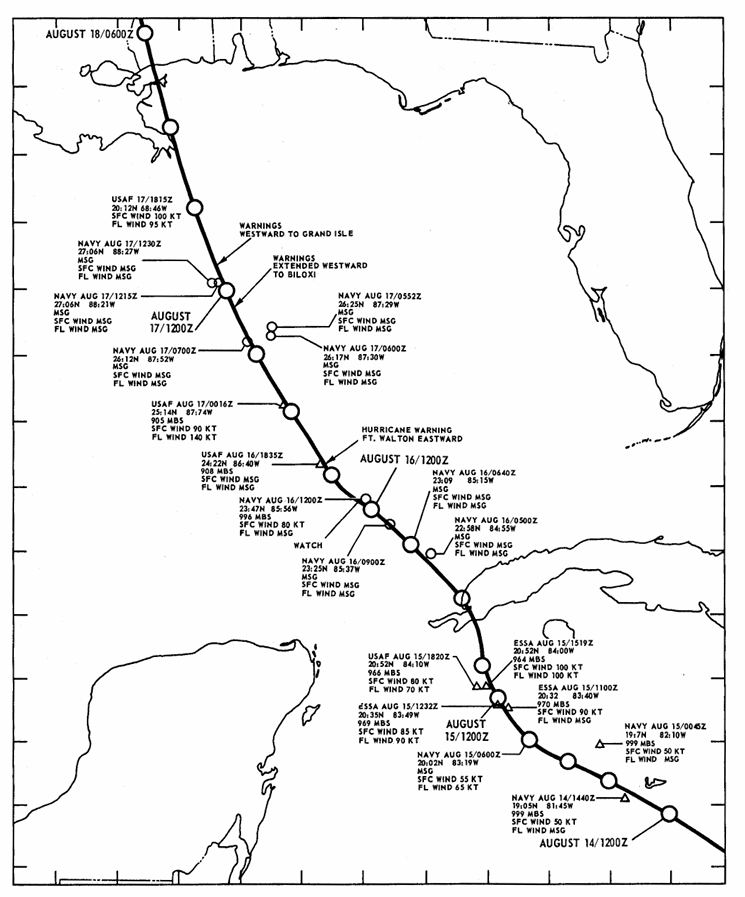
Determining where Camille would go was left to the forecasters at the National Hurricane Center, who had the help of some very simple computer models. These models were fed information on the storm’s current position and would spit out expected coordinates 12 to 72 hours into the future. The coordinates were then plotted by hand onto a map as shown below.
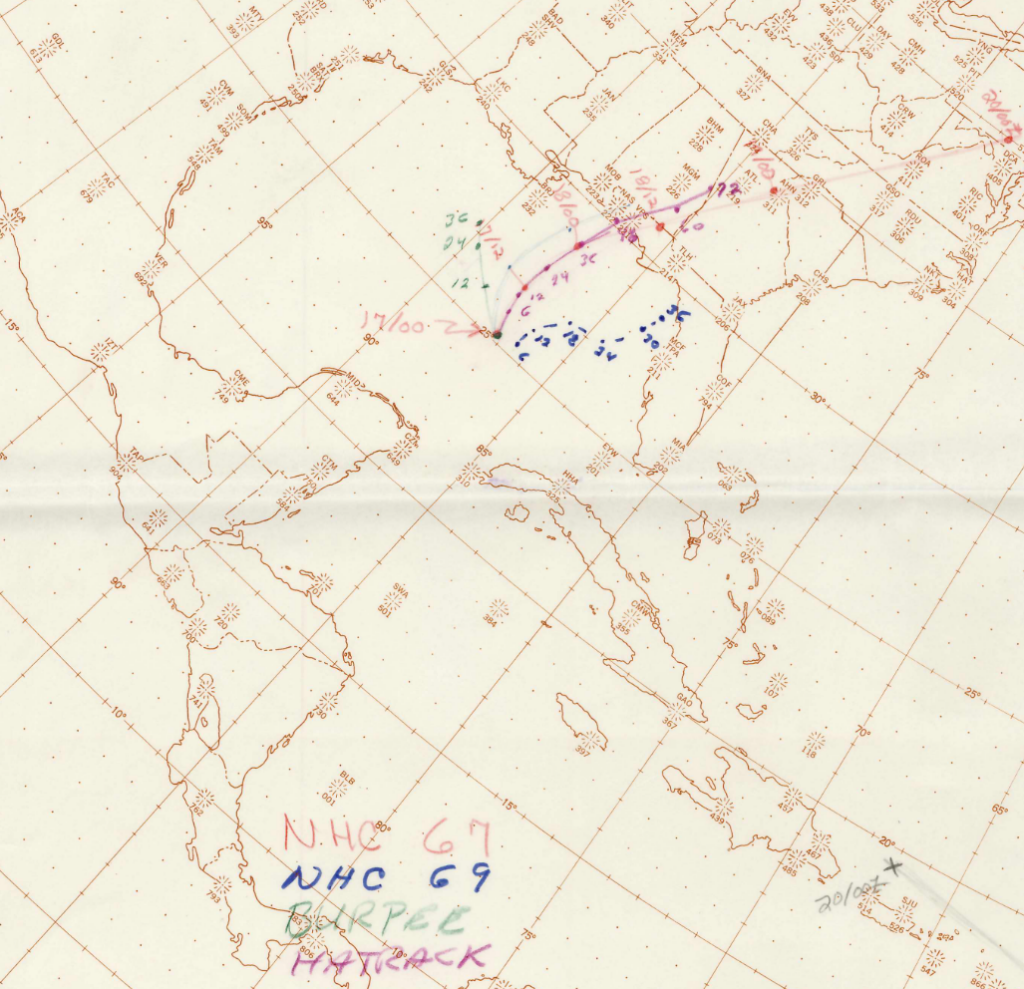
In retrospect, it appears as though the National Hurricane Center favored computer models and were confident that Camille would take a turn towards the east as the majority of models were suggesting.
This is apparent as Florida’s west coast was warned of Camille early on, while areas west of the Florida Panhandle were not.
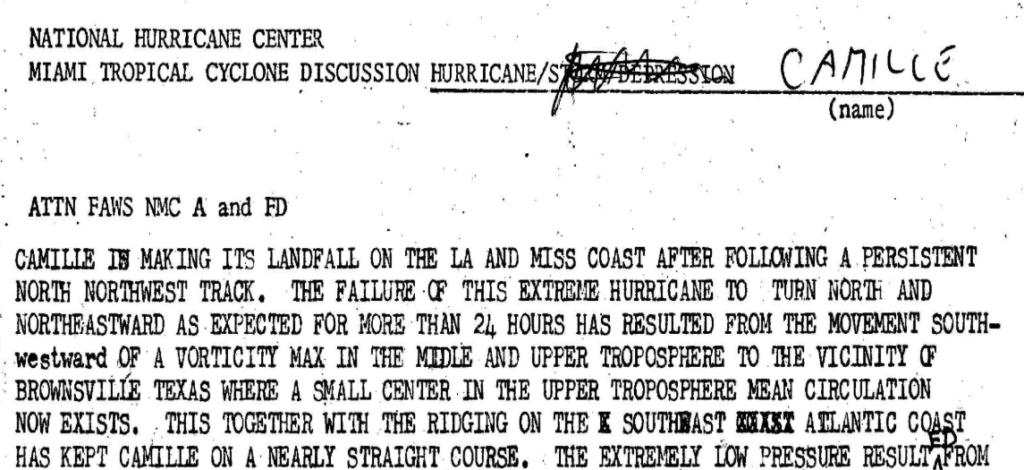
By early Sunday morning, August 17th, Camille was located 250 miles south of Mobile, Alabama, and it was becoming increasingly clear that Camille had her eyes set on the Louisiana and Mississippi coast. A discussion put out by the National Hurricane Center below states that a northeast turn was expected, but the hurricane failed to make that expected turn for more than 24 hours.
Hurricane warnings were extended to include all of the Mississippi coast and as far west as New Orleans, giving residents 18 hours to evacuate.
Camille made landfall shortly before midnight that day in Bay St. Louis, Mississippi.
CONCLUSION
The wide range of possible landfall locations made preparation difficult. Many people went to bed Sunday night believing the storm would turn northeast towards the Florida Panhandle and stayed in their homes when they should have evacuated.
Forecasters faced a difficult task, balancing information from computer models, satellites, aircraft, and weather observations to predict the storm’s path.
What was once groundbreaking technology has now become something we casually carry in our pockets via weather apps. Today, advances in forecasting have transformed how we prepare for hurricanes, stretching warning times from just 18 hours to as much as 36 hours.
REFERENCES
Mariners Weather Log. Vol. 14, no. 1, U.S. Department of Commerce, Jan. 1970.
Lybarger, Reid. “The History of Forecasting Hurricanes.” Spectrum News, 4 Sept. 2024.
Jones, Robert H. The Early Detection of Hurricanes. U.S. Weather Bureau, 1950.
“Hurricane Camille.” Wikipedia, The Free Encyclopedia, Wikimedia Foundation.
“Hurricane Camille 1969.” National Weather Service, NOAA, U.S. Department of Commerce.
Kieper, Margaret E., Christopher W. Landsea, and John L. Beven II. “A Reanalysis of Hurricane Camille.” 2016.
“Storm Wallets Archive.” National Hurricane Center, NOAA, U.S. Department of Commerce.
Storm Data, vol. 11, no. 8, U.S. Department of Commerce, Aug. 1969. NOAA National Centers for Environmental Information.
“Hurricane Camille – The Entire Story.” CM Archive, 6 Nov. 2014.
Preliminary Report: Hurricane Camille (ESSA), August 14–22, 1969. U.S. Department of Commerce, 1969.
U.S. Army Engineer District, Mobile. Report on Hurricane Camille, August 14–22, 1969. 1969.
Reade, David. Hurricane Camille: August 1969 – Reconstruction of Hurricane Reconnaissance Aircraft Operations: A Timeline. P-3 Publications, Aug. 2018.
Pielke, Roger A., Chantal Simonpietri, and Jennifer Oxelson. “Thirty Years After Hurricane Camille: Lessons Learned, Lessons Lost.” 12 July 1999.


