We have an active weather pattern continuing this upcoming week. Recall last weekend I mentioned that we had multiple rounds of storm systems set to slide through “in the coming 15 days.”
Well, we are halfway there. And coming up on Wednesday is “Round 4” from the map I posted last weekend. Once that exits on Friday, we have “Round 5” and “Round 6” back in behind it. On the map below you can see the big blobs of blue. This isn’t na indicator of cold, just the anomaly vs. normal up around 20,000ft in the air.
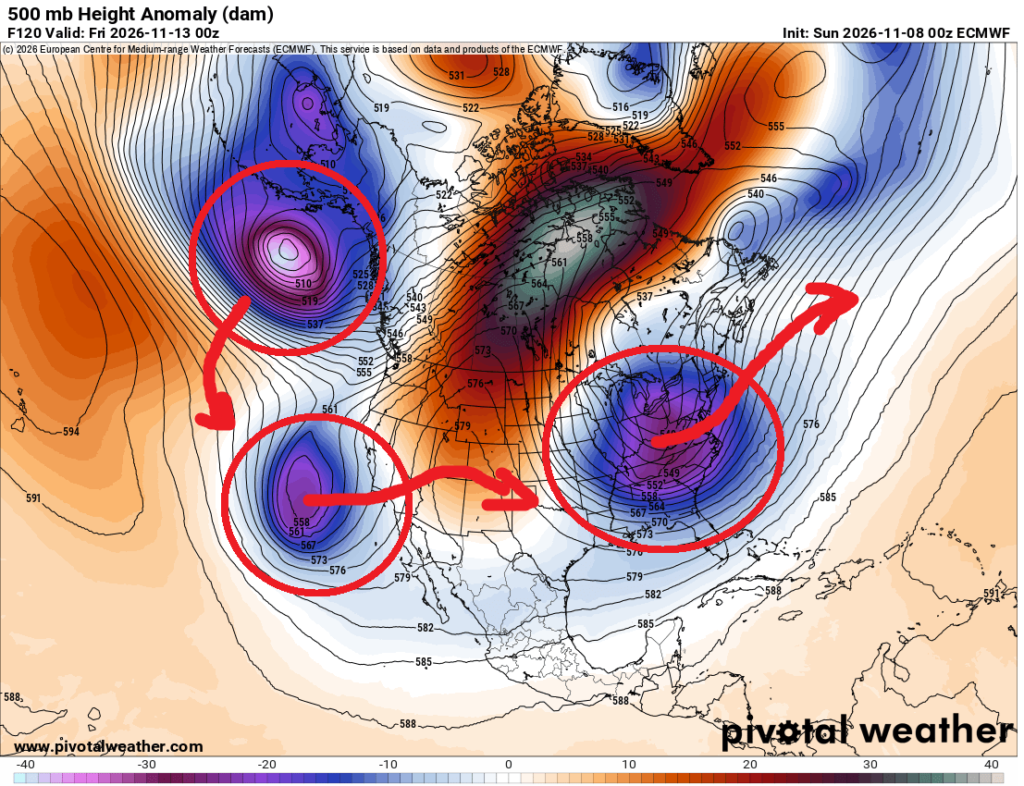
What does that mean for us? We continue to ride the Temperature Rollercoaster. Plus we get a few shots for rain here and there.
In fact, the Temperature Rollercoaster shows up really well on the Thresholds chart that we run in the background.
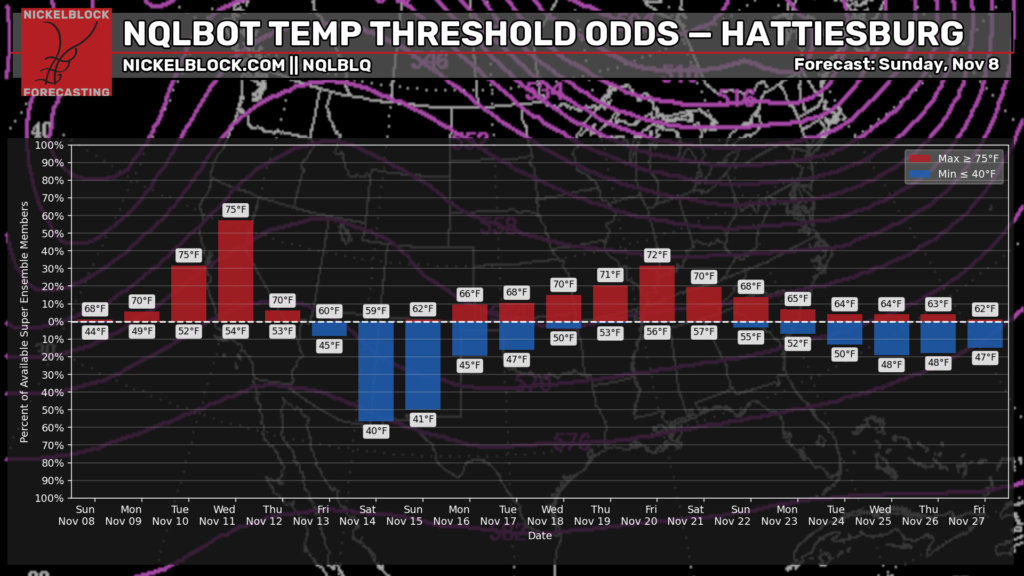
This is a bar chart with each day along the X-axis on the bottom. And the bars are “will the temperature exceed 75F?” and “Will the temperature dip below 40F?” and the Y-axis on the side shows the percent chance that we exceed that threshold.
And honestly, this might be a fun look behind the curtain about how we put together a forecast. Often times you guys probably hear about the “percent chance for rain” but we can do that with temperatures, too. And that is what this chart shows.
So, despite the forecast data supporting 75F for a high on Wednesday, the current forecast is for 77F because there is a near 60% chance we exceed 75F. And then as we move toward Saturday and Sunday, the forecast data supports lows of 40F and 41F, respectively. But the current forecast is for the upper 30s given the threshold exceedance.
Then we warm back up again. Then cool off again.
For those asking about rain, you’re right to wonder. It’s been dry.
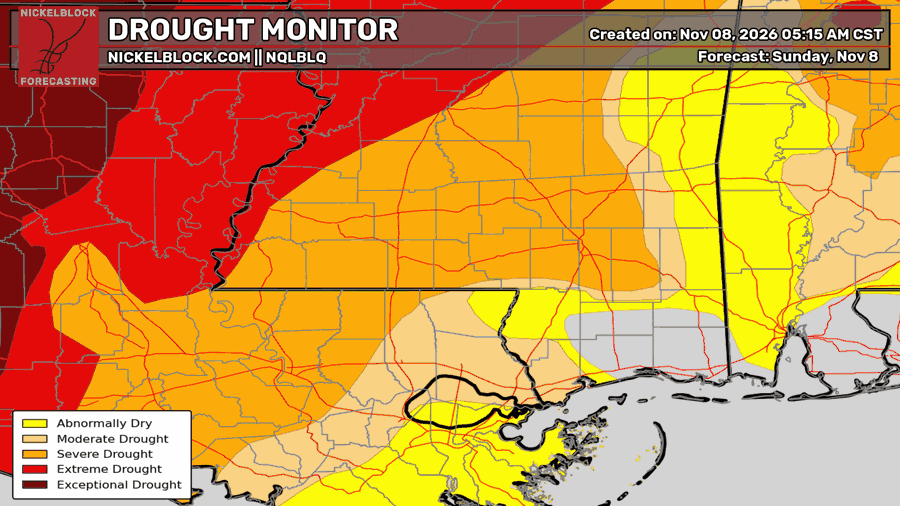
The Drought Monitor has reintroduced Moderate and Severe designations to our drought across parts of Mississippi and Louisiana. Interestingly, the last two El Nino Autumns have been quite dry and landed us in drought like this. But in both cases, November and December were rainy. So it would seem only a matter of time before the rain turns back on.
… Just not any time soon.
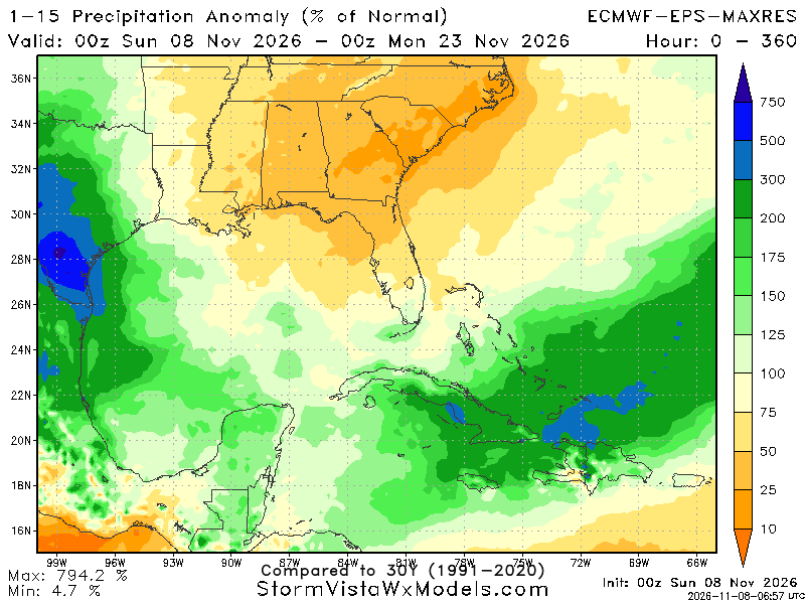
The latest forecast from the ECMWF Ensembles shows between 25% to 75% of normal rainfall during the next two weeks. With most of the rain falling across parts of South Texas or down into the Caribbean.

TODAY
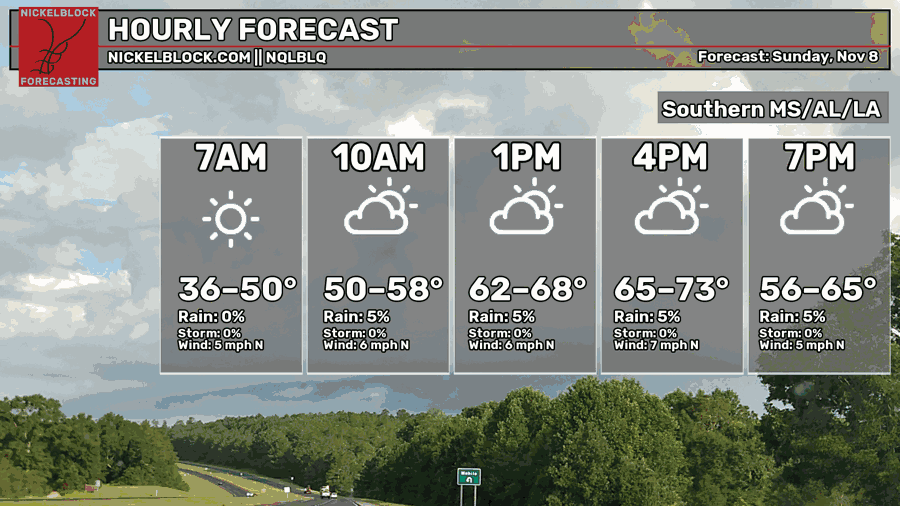
Today, temperatures will warm back into tthe 60s and 70s across the area. Shoudl be pretty nice all things considered.
Notice the “36” for this morning. Folks in Wayne, Clarke, and Lauderdale counties in Mississippi as well as Choctaw and Sumter counties in Alabama may have had some patchy frost. Same goes with anyone else farther north and northeast. I did see some reports in Covington and Smith counties of patchy frost, too.
As Rex Thompson on WDAM used to say, “We have a courtesy chance for rain” in there… mainly for folks across our western counties and over into Louisiana.

TOMORROW
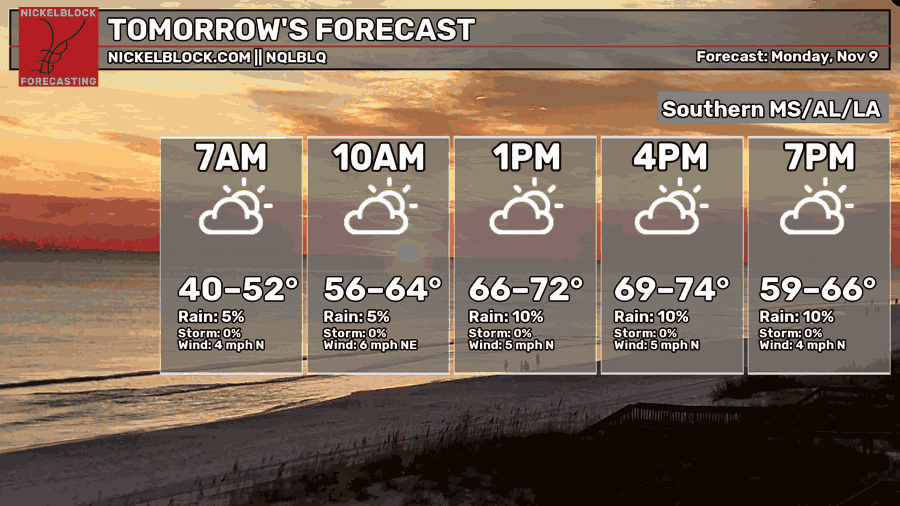
A bit of a carbon copy, tomorrow. Maybe slightly warmer. We have a little system that is falling apart that will move through. That means, in the mid-levels. we will sweep in some air from the Gulf and with enough vertical mixing during the day, we may be able to mix down an extra few degrees to our high temperatures.
We also have another “courtesy” chance for rain in there. We can’t rule it out, but I certainly wouldn’t rule it “in” either.
THE DAY AFTER
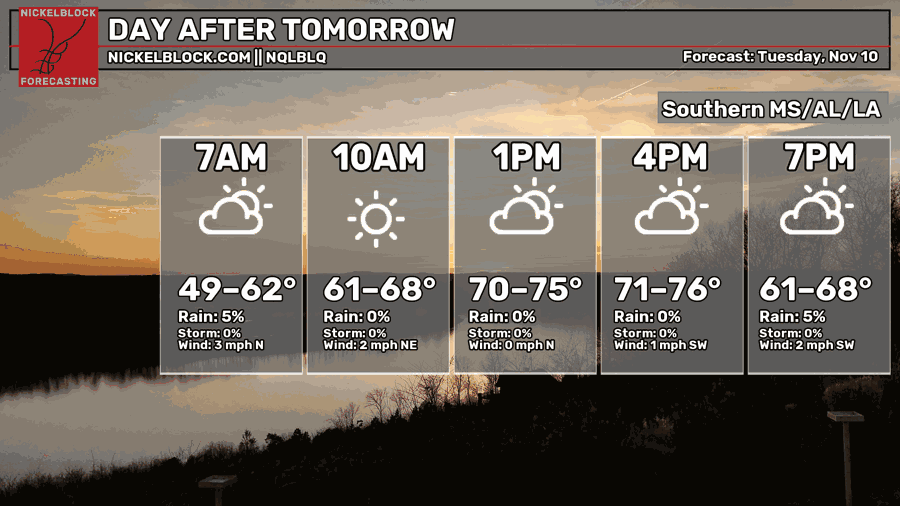
Still mild. Still dry.
Despite the active weather pattern, we can’t seem to buy a raindrop, lately. And Tuesday will be no different.
EXTENDED OUTLOOK
Since we have already discussed this upcoming week in pretty long detail, I want to bounce forward to next week. The week before Thanksgiving.
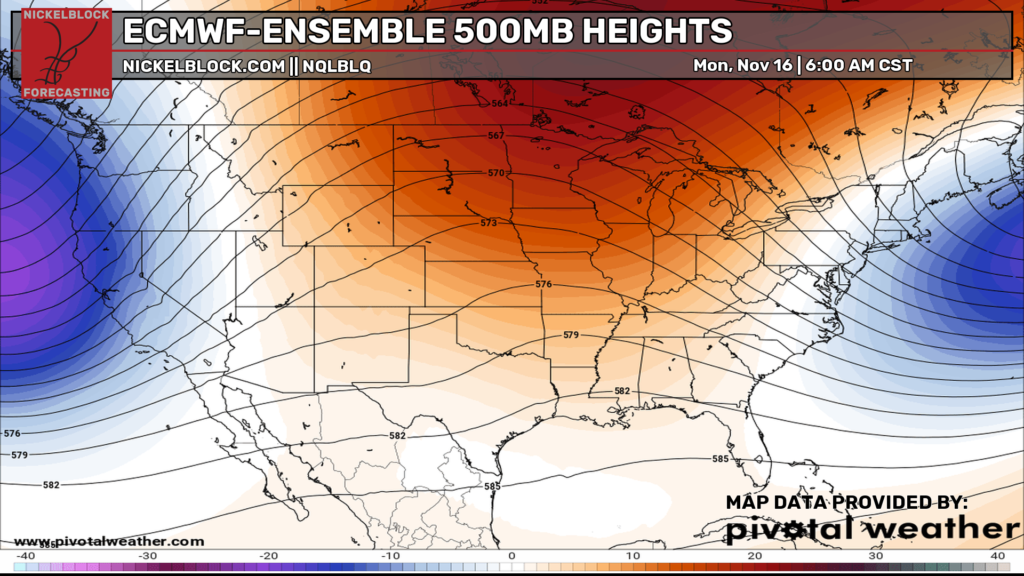
We start off the week with high pressure in the middle of the country. A bit of an Omega Block look. If this were August, I would say “buckle up for heat!” but it is November, so really, it is more like, “Buckle up for…. some dry!”
But I don’t think this pattern gets fully locked in. Again, it isn’t summer. So we should have some more transient features in the atmosphere. If you look at the ensemble guidance below the “bluest” part of the west coast trough later in the forecast period is over California and Arizona… no off the west coast as shown above.
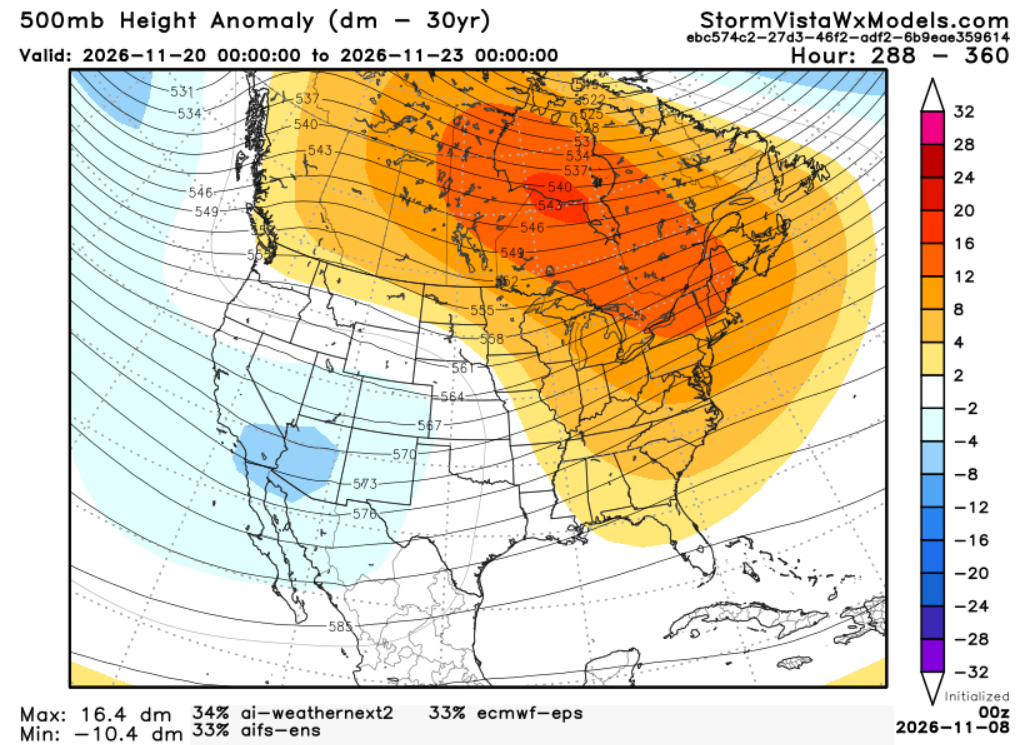
And, during that same window of time, looking at the same model guidance, we have rainfall values that are a bit more helpful for the drought. Below the maps shows rainfall values at 125% to 175% of normal.
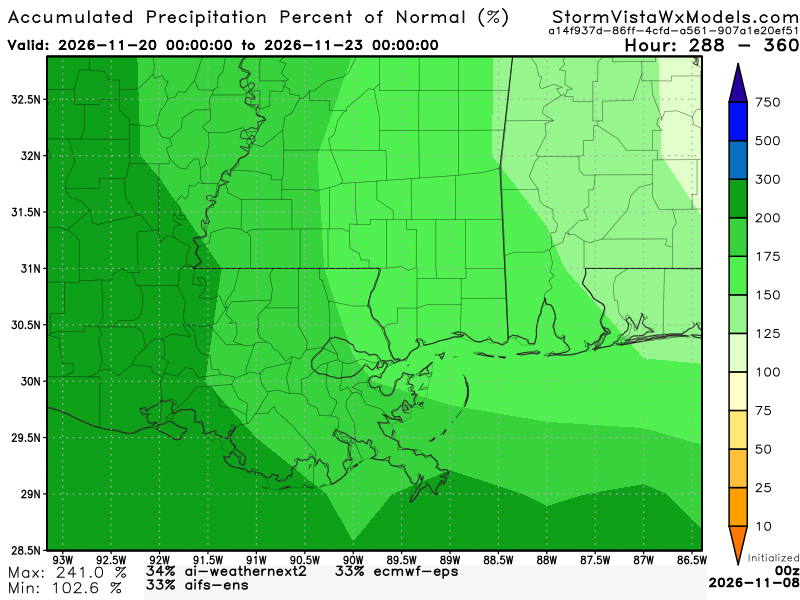
That wouldn’t mean an immediate drought buster… but it would mean some help.


