Almost nothing.
Okay, okay. Now I’m just being silly. El Nino sure has done a good number on our Hurricane Season so far. So perhaps “nothing” is a bit of an under-sell. El Nino is doing -something- for sure. It is helping to quell the Hurricanes in the Atlantic, for starters.
A Strong El Nino like this is a big deal… for Scientists. And Meteorologists. And Researchers.
But for you? On a daily basis? It is almost meaningless.
That said, I wanted to take some time and walk everyone through what an El Nino is, how it works, how it changes our weather, why it changes our weather, how it has changed our weather in the past, and some context to help you guys navigate all the hub-bub out there!
UNDERSTANDING “NOT NORMAL” WEATHER
I think a big place that seasonal outlooks gets miscommunicated (by both the sender and receiver) is what “cooler than normal” or “drier than normal” even means.
On a seasonal level, “cooler” or “warmer” simply means answering the question, “When you average the daily temperatures across the entire season, did it come out below normal or above normal?”
That’s it. Some times they’ll assign a threshold to that, like, “one standard deviation from the mean” but it is less about day-to-day changes and more about grouping a ton of days together.
It is why a “Warm” season can still have a handful of very cold days. Or a “Dry” season can feature floods and days with very heavy rain.
Okay…. Let’s talk Ninos!
BACKGROUND
So, what is an El Nino?
Whoops! Wrong Chris Farley SNL Character….
There we go!
El Nino, or +ENSO, is when there is warm water off the coast of Peru that stretches all the way out into the open Pacific. Often, the warmer waters also stretch northward up the western coast of Mexico and off the coast of California and Oregon.
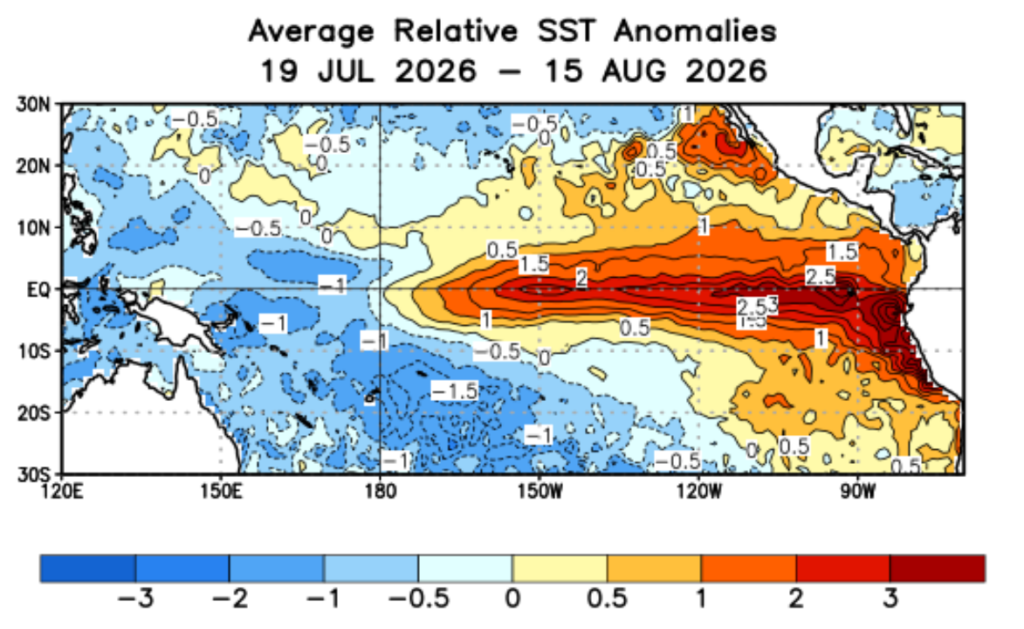
This happens because the winds that generally blow across the ocean slow down. And it allows the water to heat up more than normal.
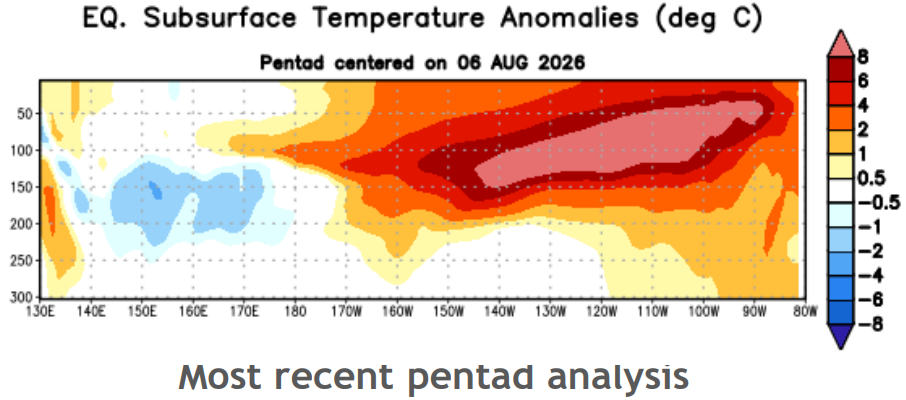
Itr isn’t just surface temperatures, either. It is also subsurface water temperatures.
Climate Scientists (like the real Scientists who study the climate, not the crazies that want you to give up driving a car and using plastic straws) measure the “ENSO state” by assigning a Oceanic Niño Index (ONI) by “using the 1991–2020 base period [3 month running mean of ERSST.v6 SST anomalies in the Niño 3.4 region (5°N–5°S, 120°–170°W) with average tropical mean (20°N–20°S) SST anomalies subtracted.”
The Nino 3.4 region is a big part of the area in the above graphics. And, when you do the math, you end up with a number between -3 and +3. Values above a 1.5 or below a -1.5 are considered a “strong” ENSO.
NERD ALERT: In recent years these same Scientists have moved to a “relative” ONI number. This relative number is an update to reflect the relative nature of the temperatures in the same Nino 3.4 region to the rest of the rest of the warming waters around the globe. As our climate continues to warm up, so do the oceans (in fact, they are a big part of all of it, but that’s for another post!). So when we measure a temperature of +2-degrees vs. normal we may think, “wow big impact!” but if the rest of the ocean waters are +1.5-degrees, then the relative change is just 0.5 degrees.
Past El Nino events, using the original ONI values, since 1990, include: 2024, 2020, 2019, 2016, 2015, 2010, 2005, 2003, 1998, 1995, 1992. Using the original ONI measurement, strong El Nino Winters were in 2023-2024, 2015-2016, 2009-2010, 1997-1998, 1991-1992.
Using the updated values, you get this list: 2024, 2019, 2016, 2015, 2010, 2003, 1998, 1995. Strong Relative ONI El Nino events happened in the Winter of 1991-1992, 1997-1998 and 2015-2016.
All of this sounds interesting, I’m sure, but what does it have to do with us? This may seem like a bit of a silly thing to be worried about up here in the United States. But! Because it is such a large volume of warmer water, it impacts the global weather patterns.
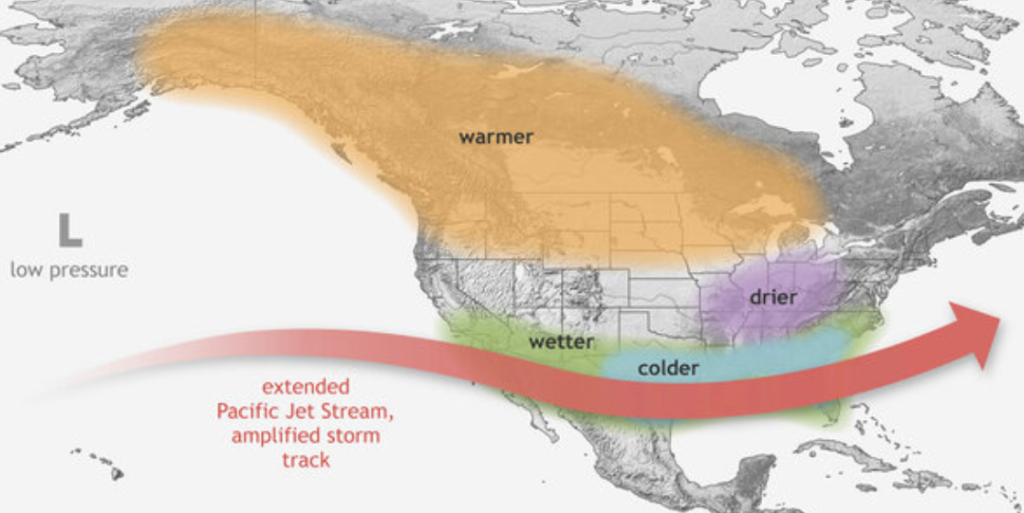
It often shifts the subtropical jet stream a bit farther northward. This also means a slight shift in the Polar jet stream, too. For the United States, the results are a cooler south (with more rain) and a drier midwest and northeast. It also means a warmer northern tier of the Lower 48.
But this is all super general.
HISTORICALLY SPEAKING
I want to get back to that Relative ONI value. When you take that Relative ONI into account, it allows us to make a better 1-to-1 comparison with past events. Below are maps of the temperatures-compared-to-normal for each ENSO Winter. From the beginning of December through the end of February.
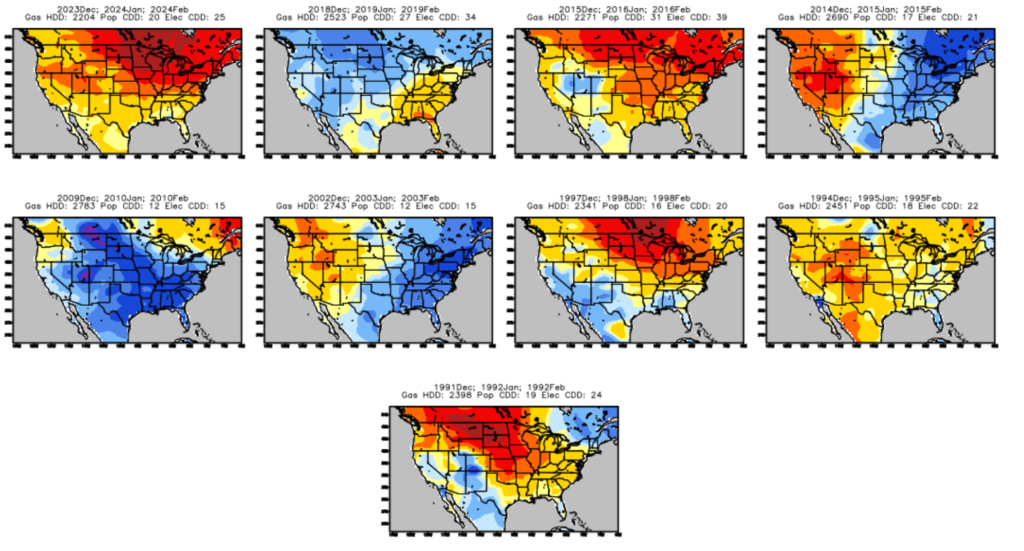
Looking at the maps above, and eyeballign things, four of the nine show cooler than normal for our area. That means five of the nine show warmer than normal…..

And yet, the NOAA map shows our area cooler than normal… despite recent history suggesting otherwise.
Of course, looking at the big picture, you can start to pick out a bit of a pattern with the Strong years. And even the not-quite as strong years (like 2023-2024).A warmer than normal northern Rockies and down into the Plains and Great Lakes. Even the Northeast looks warmer than normal across the Winter. But 2009-2010 was a “not as strong, but still very there” El Nino and it was cooler-than-normal everywhere.
Recall back in 2015-2016 winter, that was the January and February where we had storms on half of the Tuesday and Thursdays to start the year (all the way through March) with a number of those featuring the risk for severe weather.
But during the Winter of 2023-2024, we didn’t have as active of a day-to-day with severe weather. Sure, there were shots for storms, but nothing nearly as relentless.
So I’m not ready to say this Winter will feature extra storms at all.
COMPLICATING THINGS
It also turns out that when the El Nino comes to an end matters, too. Particularly to February. That 1997-1998 Nino? It flipped back into a La Nina, by value, by June of 1998. And was a strong La Nina by December of 1998! While the strong El Nino in 1991-1992 eased back to neutral by October of 1992 and then went back into another Nino during the Winter.
The 2015-2016 Strong Nino? It was also flipped back to a Nina by July of 2016. But didn’t go full-tilt into a Strong La Nina.
These Winters ended very differently for the Gulf Coast. 1992 was nice and warm, 1998 was cooler, and 2016 was also mild.
THE CURRENT OUTLOOK
So what does all of this mean for our Winter? That is To Be Determined still. I mean, It’s August!
Right now on the Relative ONI scale we are at a 1.0. The last time we were at a 1.0 this time of year while moving into an El Nino? It was 2015. Before that? It was back in 1997. The last time before that was 1965.
This doesn’t happen often. But it isn’t unprecedented yet. Once we get past 2.4, then we pass 1983 as the strongest Relative El Nino ever.
The current outlook from the Climate Prediction Center shows a Strong El Nino peaking this Winter and then easing back toward Neutral by next Summer (a bit more like 1991-1992). IT also shows us, most likely, peaking above 2.5.
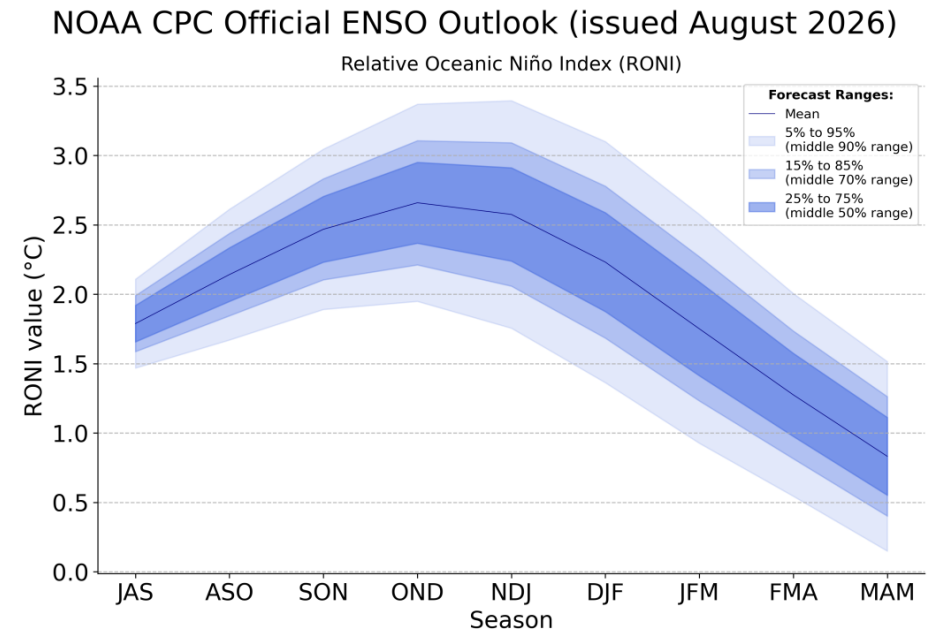
So, I suppose, we could say, “expect mild conditions, but there isn’t a strong signal toward one way or the other” and “there is a chance for a more active weather pattern this Winter” as well as “historically, stronger El Ninos tend to not be as cool for us as a normal El Nino.”
But that’s about it.
We could assert that because severe weather happened more frequently one of those years that this Winter has the chance to be like that Winter…. but that’s a mathematical stretch. Just because something happened once, doesn’t mean it will happen again. In statistics we say, “trend is friend” and “once happens, twice is a coincidence and three times is the start of a trend.”
We only have one example. So, it isn’t a trend. And I can’t, in good conscience, suggest anything specific like that at this point.
But others can…. and have.
ALL ABOARD THE HYPE TRAIN
Just don’t tell the folks, who want your attention on Social Media, that math matters. The Doom & Gloom Train is going at full steam. “This is the Strongest El Nino we’ve ever seen and Scientists can’t predict where it will stop!” and “Expect a volatile winter with the Never Seen Before El Nino!”
I think it is safe to say that this type of hyperbole is just that… Hyperbole.
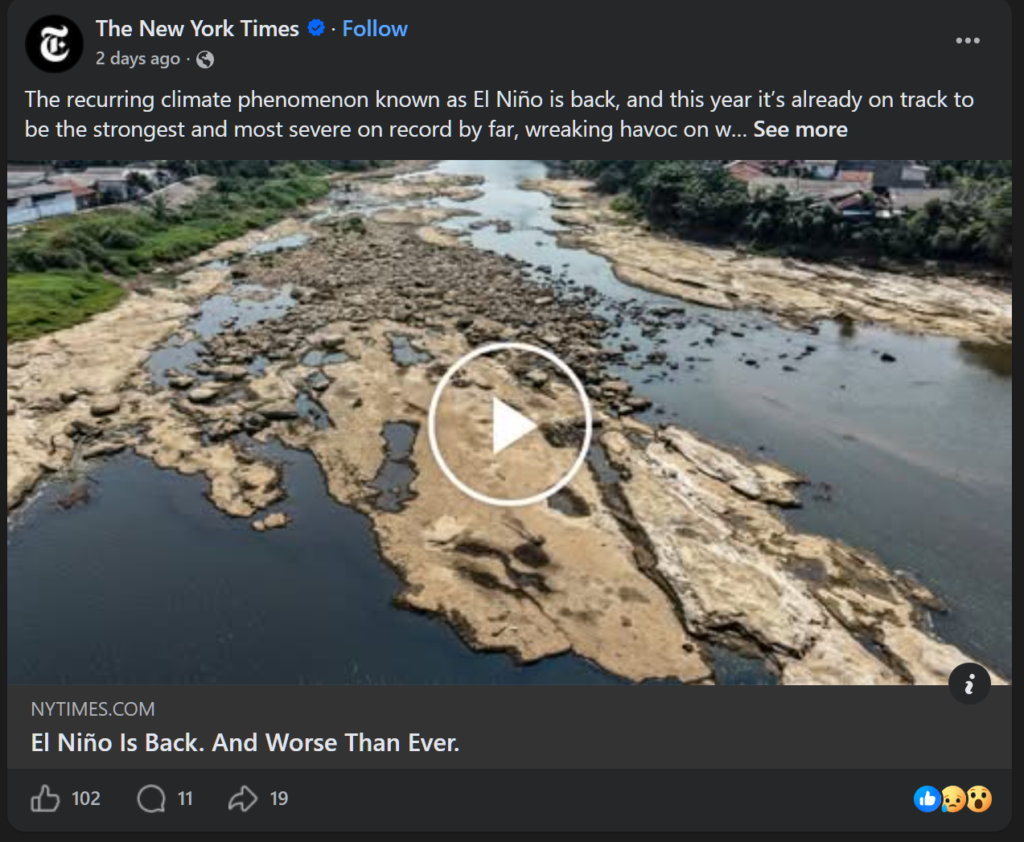
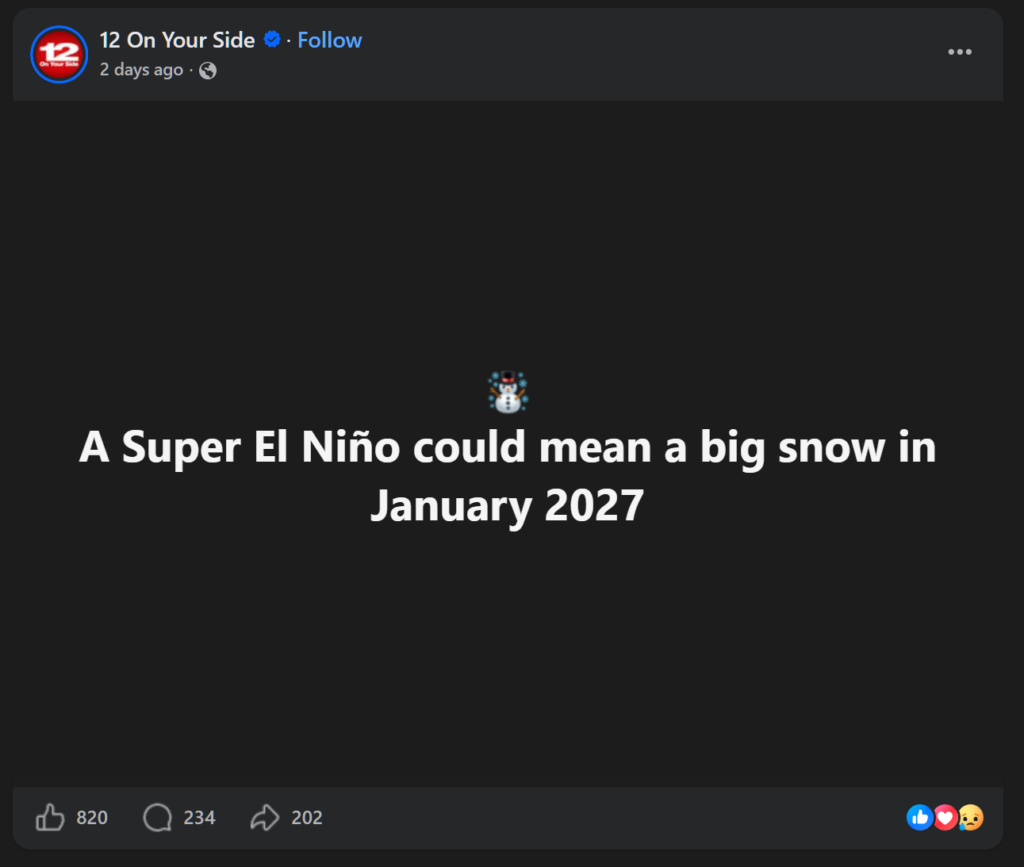
Like, what even is this? I don’t know anyone that measures ENSO by “Severity” at all. And Just because El Nino is happening doesn’t mean a singular “big snow” event is more or less likely. To be fair to “!2 on my side” they did say, “could mean” and not “will mean.”
Then there is stuff like this…
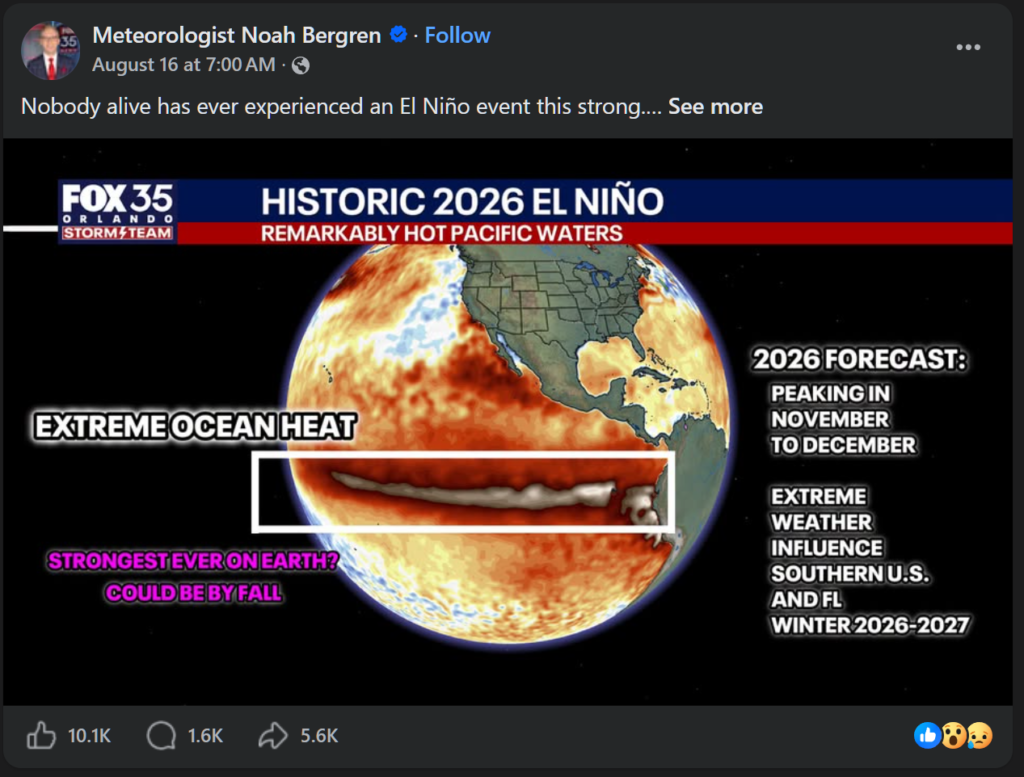
And don’t go after Noah Bergren here just because I included a snapshot. He’s a nice guy. And I assume he means well with this. But at first glance, this feels very urgent and immediate. He is talking about extreme weather for Florida and the southern US. People often connect “extreme weather” with “damaging and deadly.”
But to say it may be the strongest ever on earth is an incalculable question to ask. He is a Scientist. He should know this. And “extreme weather influence” is true, holding the poor grammar aside, but so is La Nina. Heck, so is Neutral!
For some parts of the country, the impacts will be more real. On the West Coast, for instance, they’ll see a better chance for more rain — especially in California. In the Great Lakes, they’ll see a better chance for longer stretches between snowfall. And yes, for Florida, they have a more active weather pattern and that -could- mean the risk for more storms.
But this is all speaking very generally.
And as we saw from the historic maps, each El Nino Winter was different with temperatures. Which means they’re also different with precipitation, storms, gradient wind, cloud cover, and humidity. And dozens of other parameters, too.
THE TAKE HOME POINT
As someone who does this seasonal forecasting thing for a living: Seasonal outlooks are always about managing expectations of general patterns. They are not about specifics. And El Nino, standing alone. can only tell us so much about anything.
Anyone claiming that this Super El Nino means anything specific (more storms, more severe weather, a big snowfall, more blizzards, frequent ice storms, more heatwaves, excessive floods, etc) is selling you something, not informing you.


Thanks so much. Have missed your forecasting since you left the Hattiesburg area.
I would say an ‘AMEN’ to the above comment. What I’m wondering is, which one has had a more profound effect on the hurricane season thus far … El Nino or the Saharan Dust? I ask this because, according to the weather people at a local TV station that you used to work at, they have ONLY mentioned the Saharan Dust keeping the hurricanes in check and have said almost nothing about El Nino.